Gold Price Forecast: Buyers looking for a reason to add longs
![]()
XAU/USD Current price: $1,927.83
- The US Federal Reserve looming monetary policy decision keeps investors on pause.
- Downbeat American data put the US Dollar in retreat mode in the near term.
- XAU/USD is in wait-and-see mode, although bulls still dominate the scene.
Spot gold recaptured the $1,930 threshold during European trading hours, as the US Dollar trades with a weak tone ahead of the US Federal Reserve (Fed) monetary policy decision. The Greenback is being pressured by downbeat American data, as the ADP survey on private job creation rose by a modest 106K in January, way below the anticipated 178K. Additionally, manufacturing output contracted by more than expected in January, as the ISM Manufacturing PMI slid to 47.4, down for a third consecutive month.
US stock indexes trade in the red as investors are concerned about the upcoming United States central bank announcement. The Fed has slowed the pace of tightening, but speculation that it may soon pivot has been cooled down by policymakers in the December meeting, with Chairman Jerome Powell surprising with a hawkish stance.
Indeed, inflation has receded but remains more than double the Fed’s goal. Macroeconomic figures show that the economy continues to grow despite tighter financial conditions. Furthermore, consumer confidence remains subdued while wage costs barely eased at the end of 2022. In such a scenario, it should not be surprising that the Fed would maintain its hawkish stance for a couple more meetings.
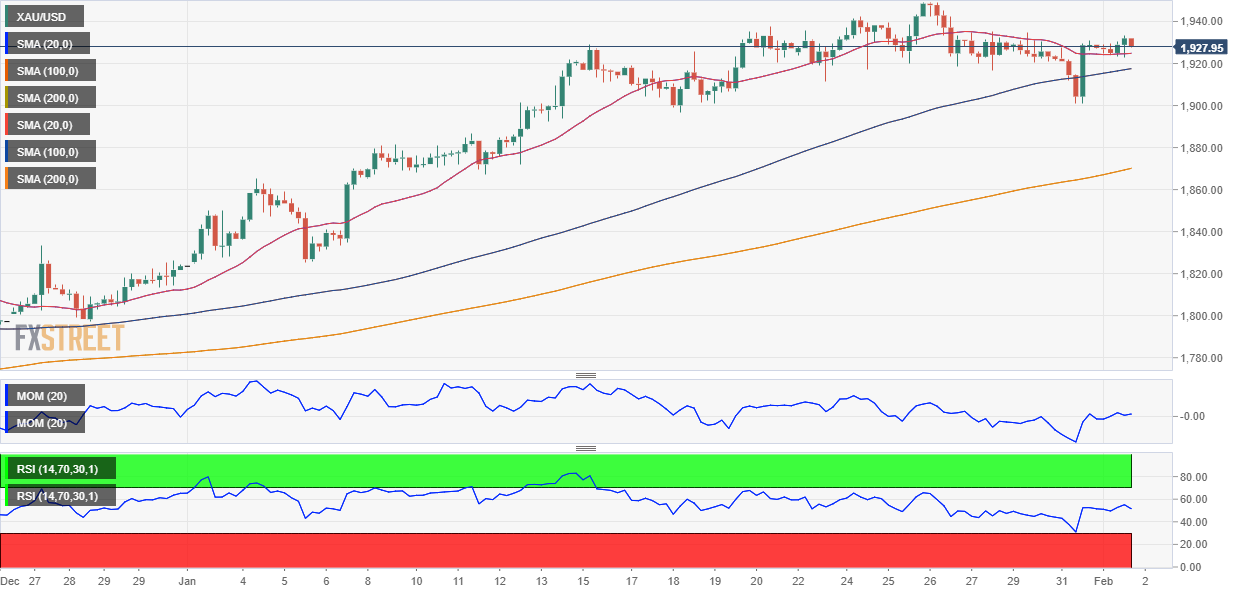
XAU/USD price short-term technical outlook
XAU/USD hovers around the $1,930 level ahead of the FOMC statement, further recovering from a weekly low of $1,900.70 posted on Tuesday and not far away from a multi-month high of $1,949.09. Technically, the risk remains skewed to the upside, although the picture can change post-Fed, particularly if gold slides below the $1,900 mark.
In the daily chart, the Relative Strength Index (RSI) indicator consolidates around 65, while the Momentum indicator eases within positive levels, as the bright metal cannot reach higher highs. Still, a bullish 20 Simple Moving Average (SMA) leads the way north by providing dynamic support at around $1,910 while advancing well above the longer ones. An immediate resistance level stands at $1,935.10, this week’s high.
In the near term, and according to the 4-hour chart, XAU/USD offers a neutral stance. The metal hovers around a directionless 20 SMA, while technical indicators head nowhere around their midlines. At the same time, gold is developing above bullish 100 and 200 SMAs, which hints at a potential test of $2,000 in the near future.
Support levels: 1,921.90 1,910.00 1,896.50
Resistance levels: 1,935.10 1,950.00 1,966.15