Monday 18th November: Weekly technical outlook and review.

Key risk events today:
Limited.
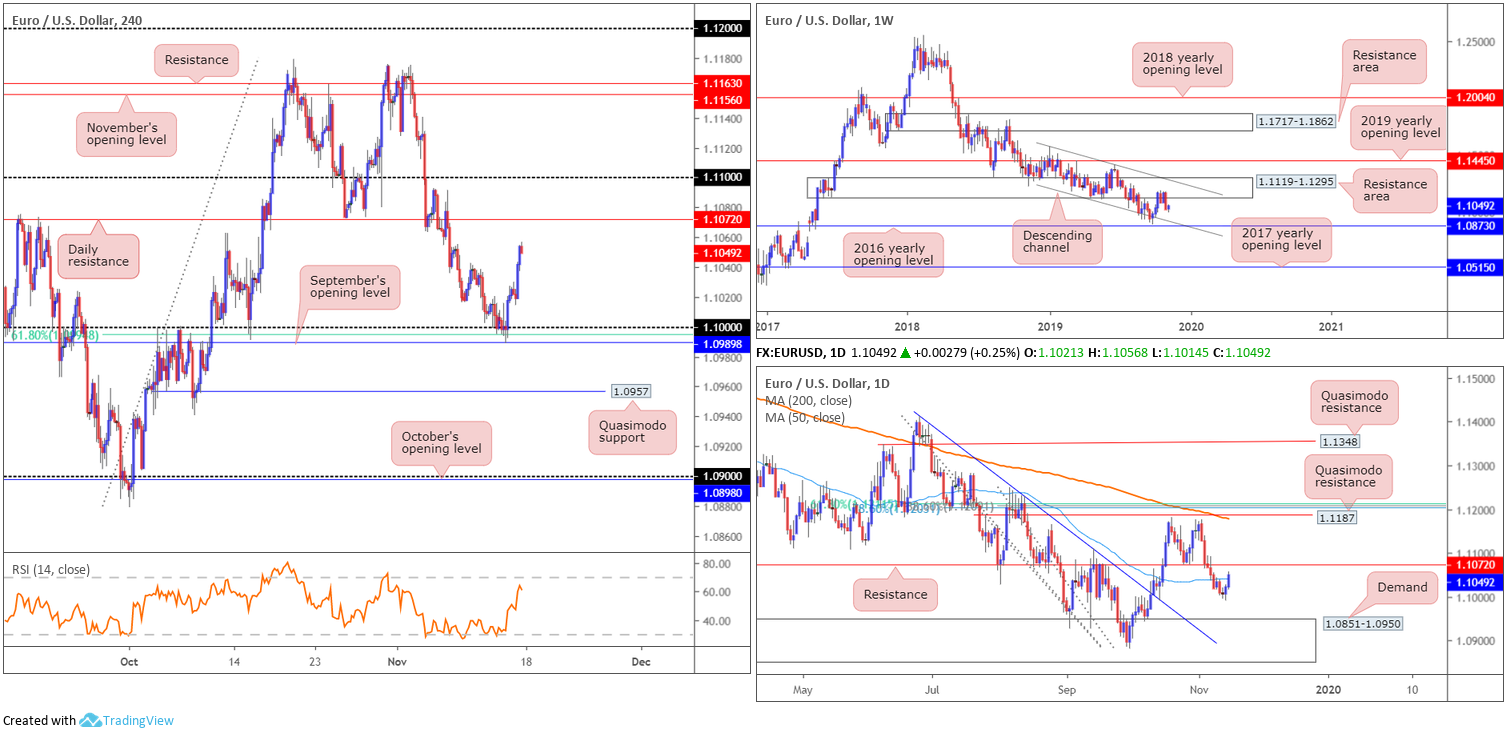
EUR/USD:
Weekly gain/loss: +0.28%
Weekly close: 1.1049
Weekly perspective:
Following a recent move out of a long-standing resistance area at 1.1119-1.1295 – worst weekly decline since August – Europe’s single currency chalked up a mild recovery last week. Further selling going forward has the lower boundary of a descending channel to target (extended from the low 1.1109), set a few points north of the 2016 yearly opening level at 1.0873.
Concerning trend direction, the primary downtrend has been in motion since topping in early 2018 at 1.2555.
Daily perspective:
Shaped by way of a bullish outside day configuration, EUR/USD movement recovered in reasonably robust fashion Thursday. Friday followed through in strong form and crossed back above the 50-day SMA (blue – 1.1040), consequently exposing a well-placed resistance coming in at 1.1072.
A decisive close north of the said resistance demonstrates seller weakness out the weekly resistance area mentioned above at 1.1119-1.1295, while a rejection potentially confirms the downside bias. Another area to keep an eye on this week is demand at 1.0851-1.0950 – houses the 2016 yearly opening level at 1.0873.
H4 perspective:
A closer reading of price action on the H4 timeframe witnessed support, a combination of the key figure 1.10, September’s opening level at 1.0989 and a 61.8% Fibonacci retracement ratio at 1.0994, hold form last week. Increased bidding will draw in daily resistance highlighted above at 1.1072 this week, closely shadowed by the 1.11 handle, which served reasonably well as support/resistance in recent weeks. A move beneath 1.10 has Quasimodo support at 1.0957 in sight. Indicator-based traders may also wish to acknowledge the relative strength index (RSI) is seen nearing overbought territory.
On the data front Friday, the US Census Bureau reported retail sales increased 0.3% last month, reversing September’s 0.3% decline. Retail sales excluding automobiles (core) picked up to 0.2% from -0.1%, although missed expectations for a 0.3% rise.
Areas of consideration:
From a technical standpoint, daily resistance at 1.1072 is key this week. Should price action remain beneath this base, further downside is likely in store for the EUR/USD, while an upside violation could prompt a retest at the weekly resistance area 1.1119-1.1295.
With the primary downtrend facing south, and price recently exiting a notable weekly resistance area, a rejection off the said daily resistance level by way of a bearish candlestick formation (either H4 or daily scale) will likely be viewed as a strong bearish indicator this week, with the option of calculating entry/risk levels based off the candle pattern.
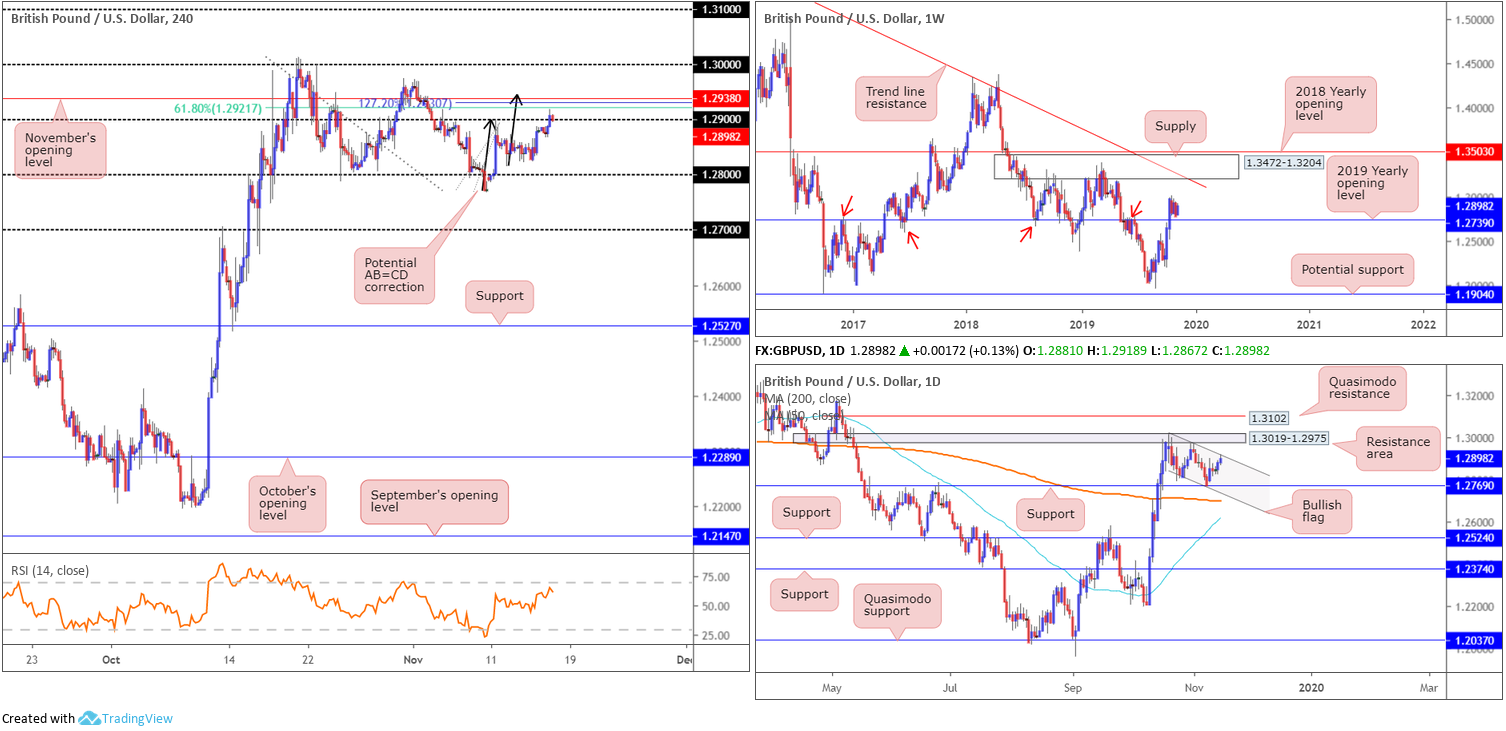
GBP/USD:
Weekly gain/loss: +0.98%
Weekly close: 1.2898
Weekly perspective:
Since tunnelling above the 2019 yearly opening level at 1.2739 and reaching highs of 1.3012, GBP/USD action has entered a phase of consolidation between the said high and 1.2768. A retest at 1.2739 as support is certainly a scenario to keep a tab on this week, having seen the level boast reasonably significant history (red arrows). To the upside on this timeframe, traders likely note supply at 1.3472-1.3204 and long-term trend line resistance etched from the high 1.5930.
The immediate trend faces a downward trajectory from 1.4376, with a break of the 1.1904 low (labelled potential support) confirming the larger downtrend from 1.7191.
Daily perspective:
Technical research on the daily timeframe reveals a bullish flag pattern (1.3012/1.2804) has been developing since price broke through resistance at 1.2769 (now a serving support). Upside on this timeframe has a resistance area plotted at 1.3019-1.2975 in view, followed closely by Quasimodo resistance at 1.3102, while a break of support mentioned above at 1.2769 has immediate support by way of the 200-day SMA (orange – 1.2699). It may also interest some traders to note the 50-day SMA (blue – 1.2618) has been advancing since early October, suggesting a cross above the 200-day SMA may be on the horizon (a Golden Cross).
H4 perspective:
Benefitting largely on the back of dollar weakness, GBP/USD advanced for a third successive session Friday, clocking highs just north of 1.29 at 1.2918. November’s opening level resides at 1.2938 as potential resistance north of here, falling in closely with a possible AB=CD correction at 1.2950 (black arrows). Higher up on the curve, the key figure 1.30 is also visible, which capped upside in October.
Areas of consideration:
Although daily price is forming a bullish flag, which traditionally should eventually break to the upside, further rejection off the top edge of the flag is a possibility this week. This, combined with the H4 AB=CD correction that terminates nearby November’s opening level at 1.2938, could offer a selling opportunity this week. Also supporting downside, H4 action has the 127.2% Fibonacci extension point at 1.2930 as well as a 61.8% Fibonacci retracement ratio at 1.2921.
Conservative traders will likely be watching for a H4 response out of the 1.2930ish region, followed up by a close below 1.29 to confirm a downside bias to 1.28 (entry and risk can be positioned according to the breakout candle’s structure).
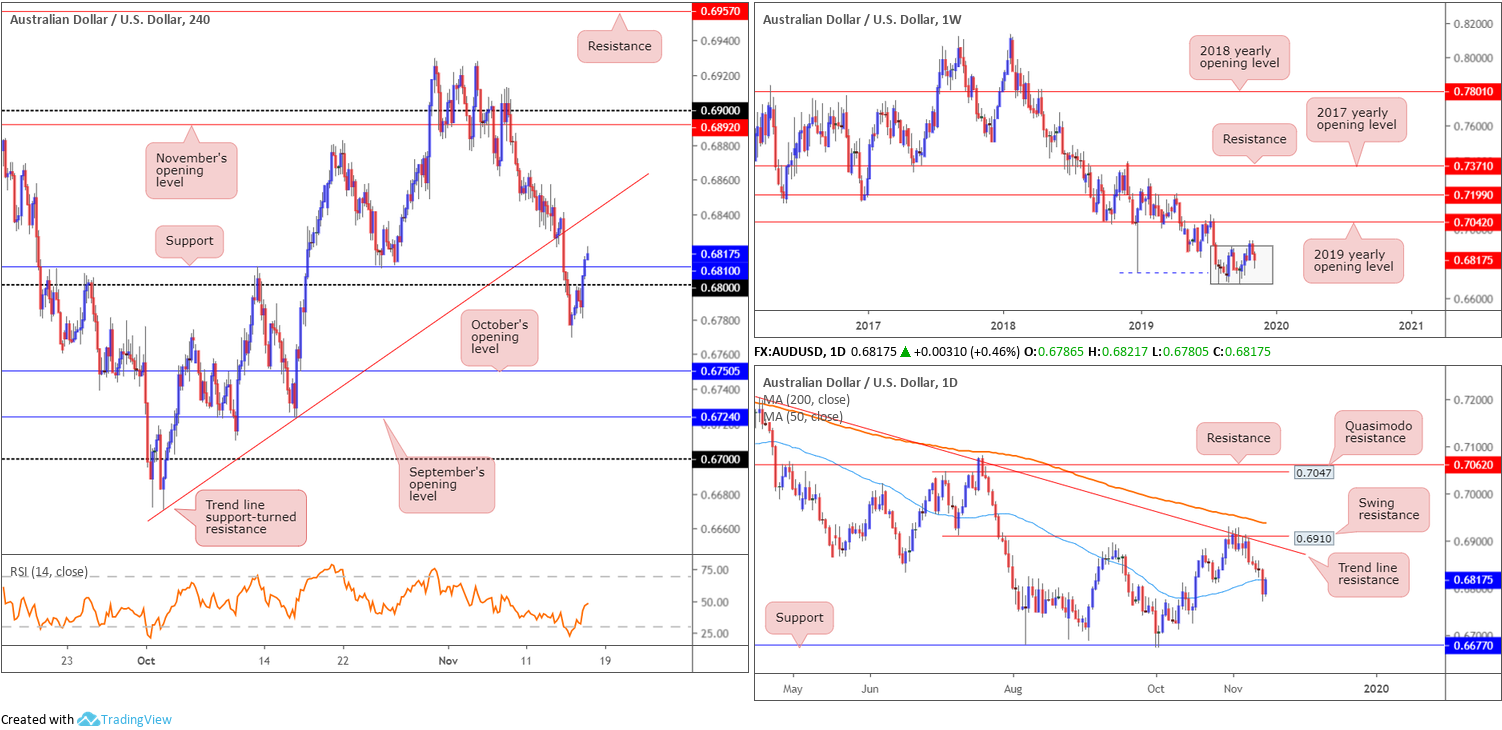
AUD/USD:
Weekly gain/loss: -0.56%
Weekly close: 0.6817
Weekly perspective:
The recent two-candle fakeout on the weekly timeframe at the top edge of a 3-month long consolidation zone between 0.6894/0.6677 (light grey) forced price marginally back into its range last week, reaching as far south as 0.6769.
With a primary downtrend in play since early 2018, breaking to lower levels over the coming weeks is likely.
Daily perspective:
Snapping a five-day losing streak, AUD/USD activity on the daily timeframe recovered Friday and reclaimed a large portion of Thursday’s downside move. Upside may struggle in early trade this week as sellers could attempt to defend the underside of the 50-day SMA (blue – 0.6816).
A move higher, nonetheless, could stretch as far north as trend line resistance extended from the high 0.7393, closely followed by swing resistance pencilled in at 0.6910. Although a move higher came about off 0.6780, the more visible support on the daily timeframe remains around 0.6677.
H4 perspective:
Friday’s action on the H4 scale forced a move north through orders at 0.68 and resistance coming in at 0.6810 (now an acting support). The pair gathered momentum amid US hours, lifted on renewed hopes of a trade deal between the US and China. NEC Director Kudlow set the positive tone, noting that US and China are on the short strokes of a phase one deal.
Should buyers set a defensive tone above 0.68 this week, trend line support-turned resistance (taken from the low 0.6670) may enter the fold. Indicator-based traders will also likely want to note the relative strength index (RSI) is seen nearing the underside of the 50.0 mid-way point.
Areas of consideration:
While the shorter-term outlook on the H4 portends a move north this week, traders are urged to tread carefully. The fact daily price is testing the underside of its 50-day SMA and weekly flow suggests further selling could be seen will likely weigh on any upside attempts.
On account of the above analysis, its unlikely H4 price will move beyond its trend line resistance. Should the higher-timeframe analysis prove correct, and H4 price breaks back beneath 0.68, bearish scenarios are then an option, targeting October’s opening level at 0.6750 as the initial port of call.
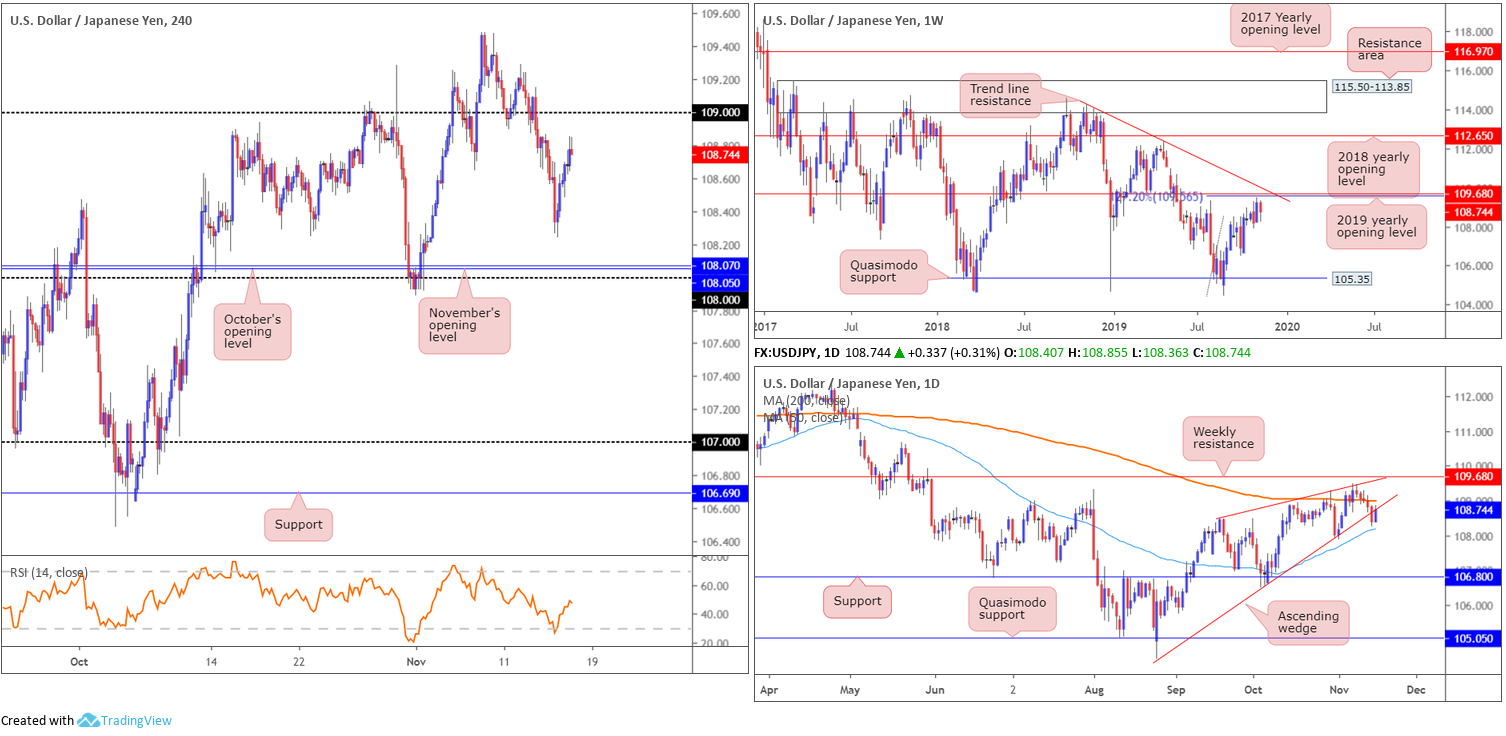
USD/JPY:
Weekly gain/loss: -0.43%
Weekly close: 108.74
Weekly perspective:
Technical research based on the weekly timeframe had the USD/JPY contained within the prior week’s range (109.48/108.18) last week. Structurally, resistance is seen close by in the form of the 2019 yearly opening level at 109.68 and a 127.2% Fibonacci ext. point at 109.56 (taken from the low 104.44). Also sited nearby is trend line resistance extended from the high 114.23.
In regards to the market’s primary trend, the pair has been entrenched within a range since March 2017, spanning 115.50/105.35.
Daily perspective:
Daily price recently tunnelled through the lower edge of an ascending wedge formation (104.44), which has been unfolding since early September. The week ended with the unit retesting the underside of the broken wedge.
Support on the daily timeframe can be found close by at the 50-day SMA (blue – 108.20). A break of here and the 107.88 November 1 low could see a run back towards support at 106.80.
H4 perspective:
Friday’s positive trade-related headlines weighed on the safe-haven Japanese yen, bolstering USD/JPY movement. Mixed US monthly retail sales figures did little to impress, with the closing H4 candle concluding in the shape of a shooting star formation (considered a bearish signal), south of the 109 vicinity. Aside from Thursday’s low 108.24, the next layer of support on this scale can be seen around the 108 handle, layered further with November and October’s opening levels at 108.05 and 108.07, respectively.
Areas of consideration:
Although H4 price may look to revisit the underside of 109 this week, the fact we’re retesting the underside of a long-standing daily wedge (see above) in the form of a H4 shooting star candlestick pattern is likely enough to entice sellers into the market this week. Conservative stop-loss placement is seen around 109.16, which not only clears 109 but also the 200-day SMA on the daily timeframe (orange – 108.99).
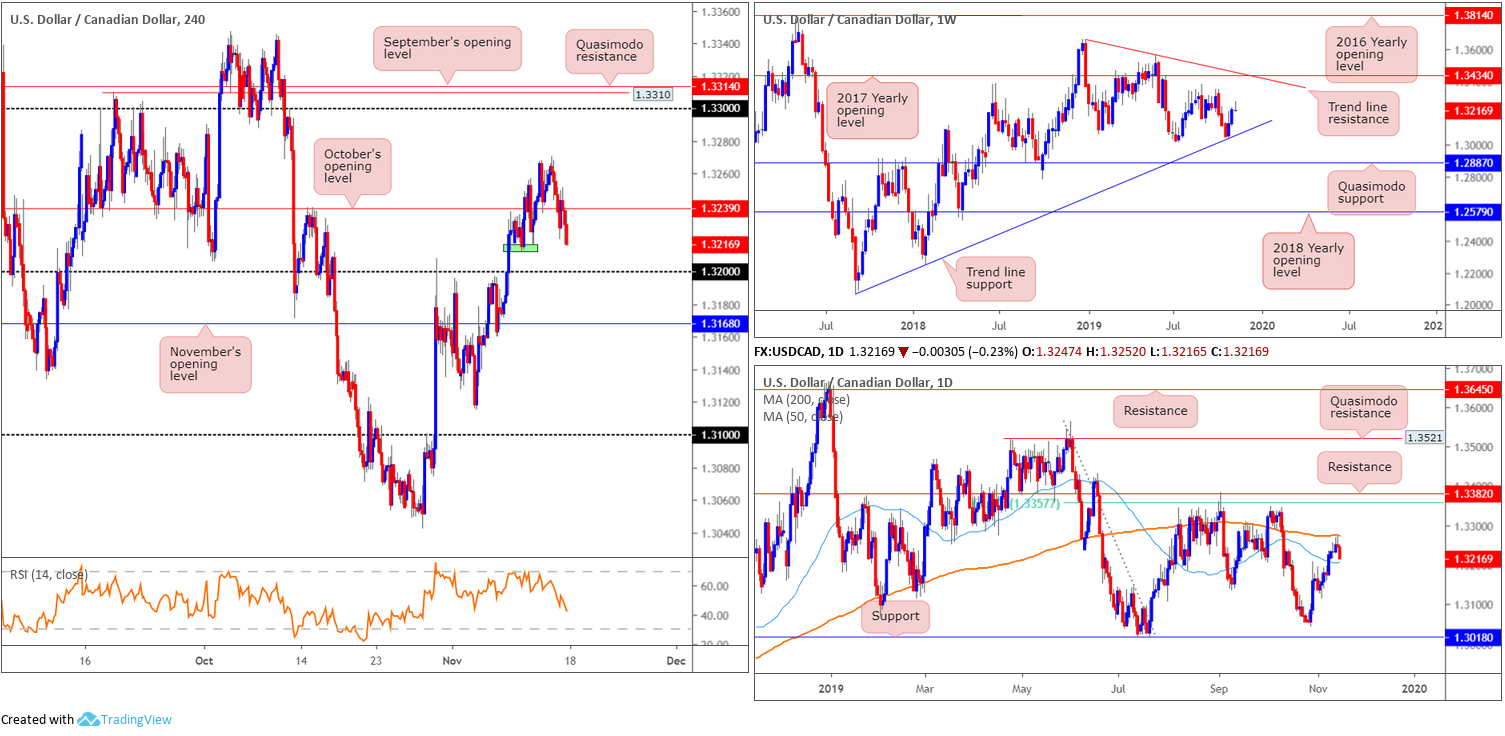
USD/CAD:
Weekly gain/loss: -0.06%
Weekly close: 1.3216
Weekly perspective:
In shape of a gravestone doji candlestick formation, clocking a session high of 1.3270, USD/CAD finished the week mostly unmoved. Formed following two weeks of solid gains off trend line support (taken from the low 1.2061), the recently formed candlestick configuration signals sellers may make an appearance this week.
Additional upside from this point, however, has tops around 1.3342 in sight, closely followed by the 2017 yearly opening level at 1.3434 and trend line resistance taken from the peak at 1.3661.
Overall, the immediate trend faces north since bottoming in September 2017, though this move could also be considered a deep pullback in a larger downtrend from the 1.4689 peak in early January 2016.
Daily perspective:
Thursday concluded in the form of a shooting star candlestick pattern (considered a bearish signal), sited just south of the 200-day SMA (orange – 1.3275), and followed through with a near-full-bodied bearish close Friday. As you can see, the unit ended the day closing within striking distance of the 50-day SMA (blue – 1.3207).
Beyond the noted SMAs, resistance resides around the 1.3382 neighbourhood/61.8% Fibonacci retracement ratio at 1.3357, while support can be found at the 1.3042 October 29 low, closely followed by support at 1.3018.
H4 perspective:
Crude markets closed firmer on Friday, as sentiment took a turn for the better in the US trading session, consequently bolstering the Canadian dollar. This, along with a declining US dollar index, sent USD/CAD southbound, wrapping up within close proximity of the 1.32 handle. Note the 1.32 level also coincides closely with the 50-day SMA applied to the daily timeframe.
Areas of consideration:
In essence, we have the recently closed weekly candle emphasising a bearish tone, daily price, although closing strongly lower, trading within touching distance of the 50-day SMA and H4 action eyeing a retest of 1.32.
Shorter term, H4 price will likely dive through 1.3212 (green zone), trip lower-timeframe sell stops, and test 1.32 for a bounce higher. 1.32 is, as highlighted above, supported by the 50-day SMA. The initial upside target from here is set around October’s opening level at 1.3239.
Longer term, it is a difficult read at the moment, given we remain confined between two SMAs on the daily timeframe.
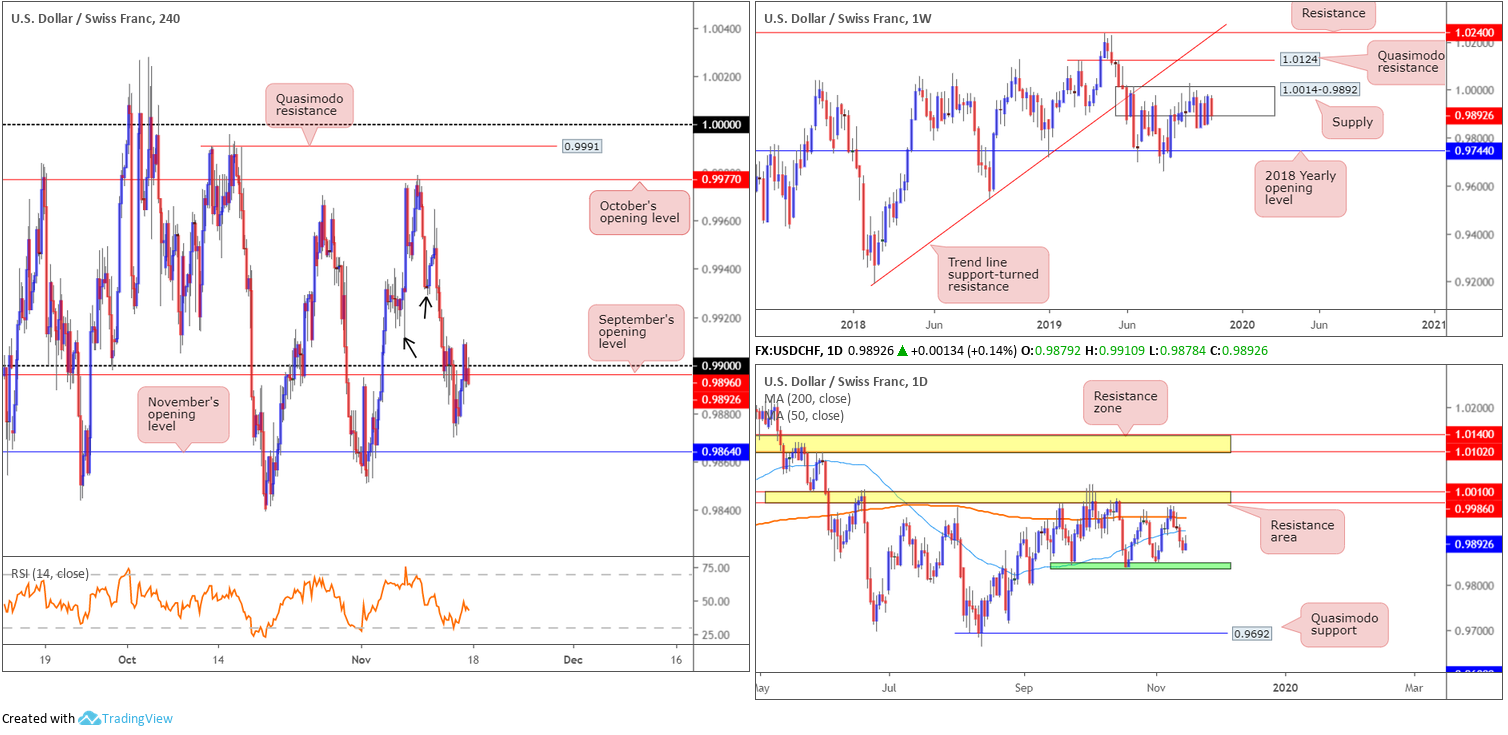
USD/CHF:
Weekly gain/loss: -0.78%
Weekly close: 0.9892
Weekly perspective:
Supply at 1.0014-0.9892 remains in play, despite months of consolidation. As highlighted in previous weekly reports, the beginning of October witnessed a penetration to the outer edge of the supply area’s limit, possibly tripping a portion of buy stops and weakening sellers. An upside move out of the said supply may draw in Quasimodo resistance at 1.0124, while downside has the 2018 yearly opening level at 0.9744 in sight.
According to the primary trend, price also reflects a slightly bullish tone; however, do remain aware we have been rangebound since the later part of 2015 (0.9444/1.0240).
Daily perspective:
Since mid-September, buyers and sellers have been busy carving out a consolidation between support around the 0.9845ish region (green) and a resistance area coming in at 1.0010/0.9986. Interestingly, between the said range, the 200-day and 50-day SMAs are seen closing in on each other (orange – 0.9951/blue – 0.9923).
H4 perspective:
A brief recap of Friday’s price action on the H4 timeframe shows the pair attempted to regain position above 0.99, though stumbled during the US session to close at 0.9892. November’s opening level at 0.9864 offers nearby support, followed by 0.9845ish on the daily timeframe. Above 0.99, aside from 0.9911 and 0.9932 (black arrows), upside appears reasonably free until October’s opening level at 0.9977.
Areas of consideration:
In absence of clear market direction on either the weekly and daily timeframes, high-probability trading opportunities are limited.
Longs above 0.99 this week must contend with the 50-day SMA at 0.9923 and 0.9911/0.9932. Selling from 0.99, nonetheless, exhibits some space to manoeuvre to the 0.9870 low (Thursday’s low) and November’s opening level at 0.9846, though is still incredibly tight.
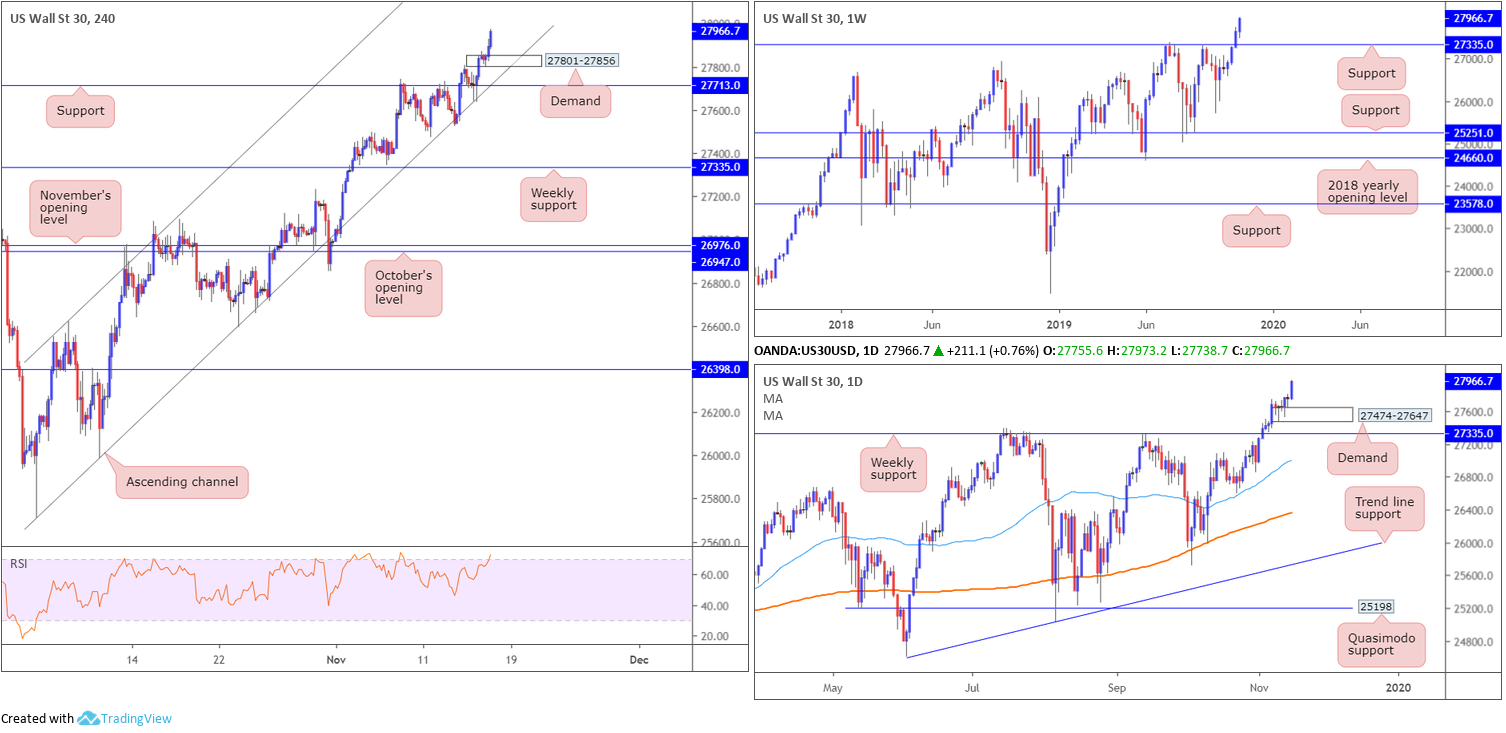
Dow Jones Industrial Average:
Weekly gain/loss: +1.16%
Weekly close: 27966
Weekly perspective:
Closing at fresh records for a second successive week, US equities added more than 300 points last week, according to the Dow Jones Industrial Average benchmark.
Resistance at 27335 gave way recently, allowing the index to clock an all-time high of 27973. On account of this, a pullback to 27335 could be in store over the coming weeks for potential long opportunities.
Daily perspective:
Technically speaking, there’s little difference between the weekly and daily timeframes this week. Weekly support is also set as a central floor on this scale at 27335, though local demand coming in at 27474-27647 may also hinder downside.
H4 perspective:
US equities finished firm on Friday amid revived hopes for a US/China trade deal, despite mixed macroeconomic data. The Dow Jones Industrial Average added 222.93 points, or 0.80%; the S&P 500 advanced 22.83 points, or 0.77% and the tech-heavy Nasdaq 100 rallied 57.69 points, or 0.70%.
For traders who remain long Thursday’s H4 hammer candlestick formation (considered a bullish signal at troughs) off channel support extended from the low 25710, ended the week in strong profits. Moving the protective stop-loss order to beneath 27801 (the lower edge of demand) is now an option, should you wish to trail profits.
Areas of consideration:
A pullback to H4 demand at 27801-27856, given the strength of the uptrend right now, is certainly a potential scenario this week, particularly at the point it merges with the current H4 channel support. Traders wishing to add a little more confirmation to the mix may wait and see if H4 price chalks up an additional candlestick pattern before pulling the trigger; entry and risk can then be calculated based on this structure.
Failure to hold the current H4 demand will see traders shift focus to H4 support at 27713 for long opportunities, though do remain cognisant of the top edge of daily demand at 27647 lurking just beneath this barrier.
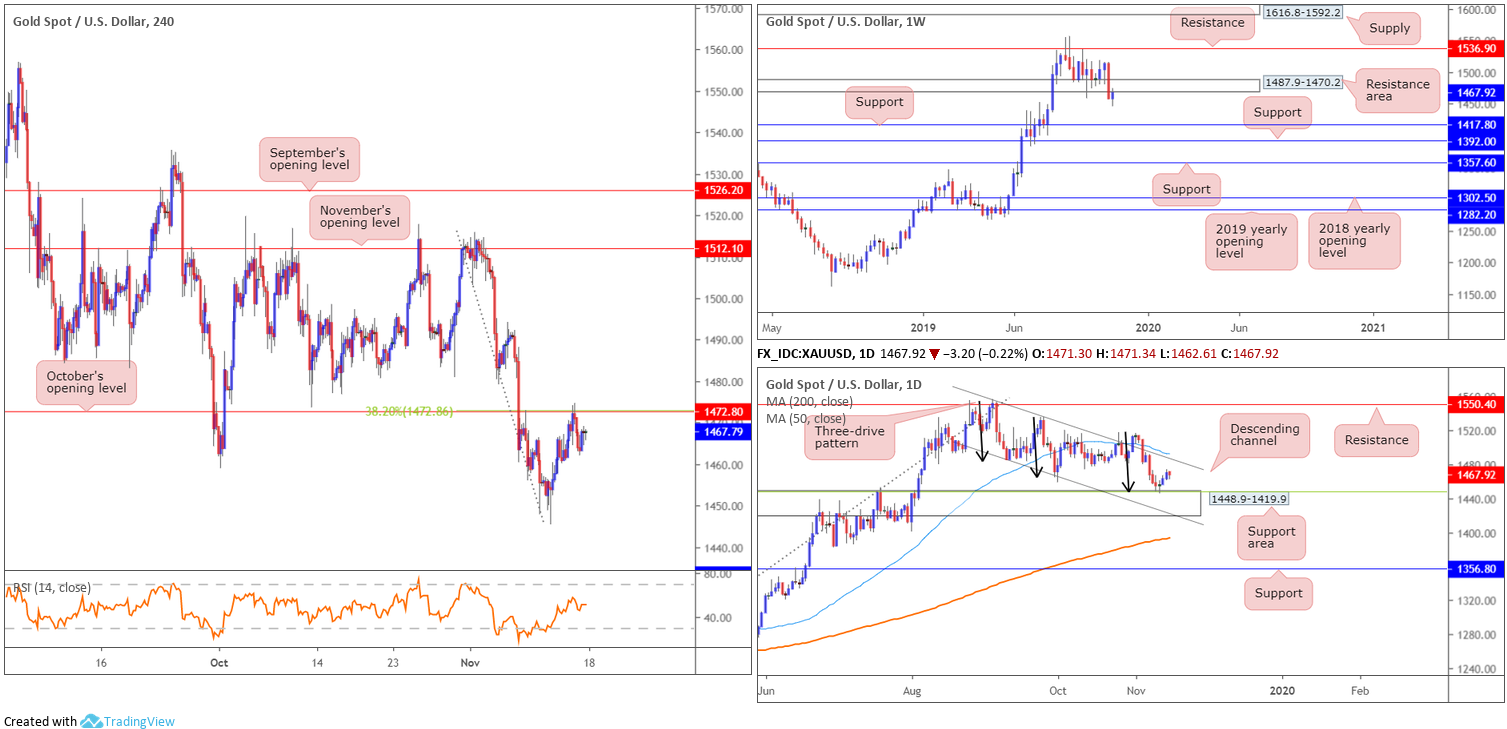
XAU/USD (GOLD):
Weekly gain/loss: +0.63%
Weekly close: 1467.9
Weekly perspective:
Following hefty losses against the dollar, the price of gold recovered somewhat last week and retested the lower edge of a support-turned resistance area at 1487.9-1470.2. Rejection off the underside of this base potentially sets the long-term stage for a move towards two layers of support at 1392.0 and 1417.8.
Daily perspective:
In terms of daily positioning, the candles remain confined within a descending channel formation (taken from the high 1557.1 and a low of 1484.6). Additionally, last week observed daily price cross swords with the top edge of a support area coming in at 1448.9-1419.9 (aligns closely with a 38.2% Fibonacci retracement ratio at 1448.5). What’s also interesting here is the completion of a three-drive pattern around the top edge of the said support zone (black arrows).
H4 perspective:
Traders who read Friday’s technical briefing may recall the following piece:
Across the page on the H4 timeframe, as expected, the candles retested October’s opening level at 1472.8, which aligns with a 38.2% Fibonacci retracement ratio. The recent H4 candle close lower from here is significant and likely enough to draw in further selling today for a possible revisit of the daily support area mentioned above at 1448.9-1419.9.
As evident from the chart, price did indeed attempt to navigate lower ground, though failed to sustain downside beyond 1462.2.
Areas of consideration:
Traders who remain short based on Thursday’s price action, with protective stop-loss orders above the current weekly resistance area at 1487.9, are likely holding ground as the top edge of the daily support area at 1448.9-1419.9 remains the initial downside target.
Those who entered long from the current daily support area, however, may feel the sting of weekly sellers this week, therefore close attention to any long positions in this market is recommended.
The accuracy, completeness and timeliness of the information contained on this site cannot be guaranteed. IC Markets does not warranty, guarantee or make any representations, or assume any liability regarding financial results based on the use of the information in the site.
News, views, opinions, recommendations and other information obtained from sources outside of www.icmarkets.com.au, used in this site are believed to be reliable, but we cannot guarantee their accuracy or completeness. All such information is subject to change at any time without notice. IC Markets assumes no responsibility for the content of any linked site.
The fact that such links may exist does not indicate approval or endorsement of any material contained on any linked site. IC Markets is not liable for any harm caused by the transmission, through accessing the services or information on this site, of a computer virus, or other computer code or programming device that might be used to access, delete, damage, disable, disrupt or otherwise impede in any manner, the operation of the site or of any user’s software, hardware, data or property.