Friday 10th April: Technical Outlook and Review

Key risk events today:
China CPI y/y and PPI y/y; US CPI m/m and Core CPI m/m.
(Previous analysis as well as outside sources – italics).
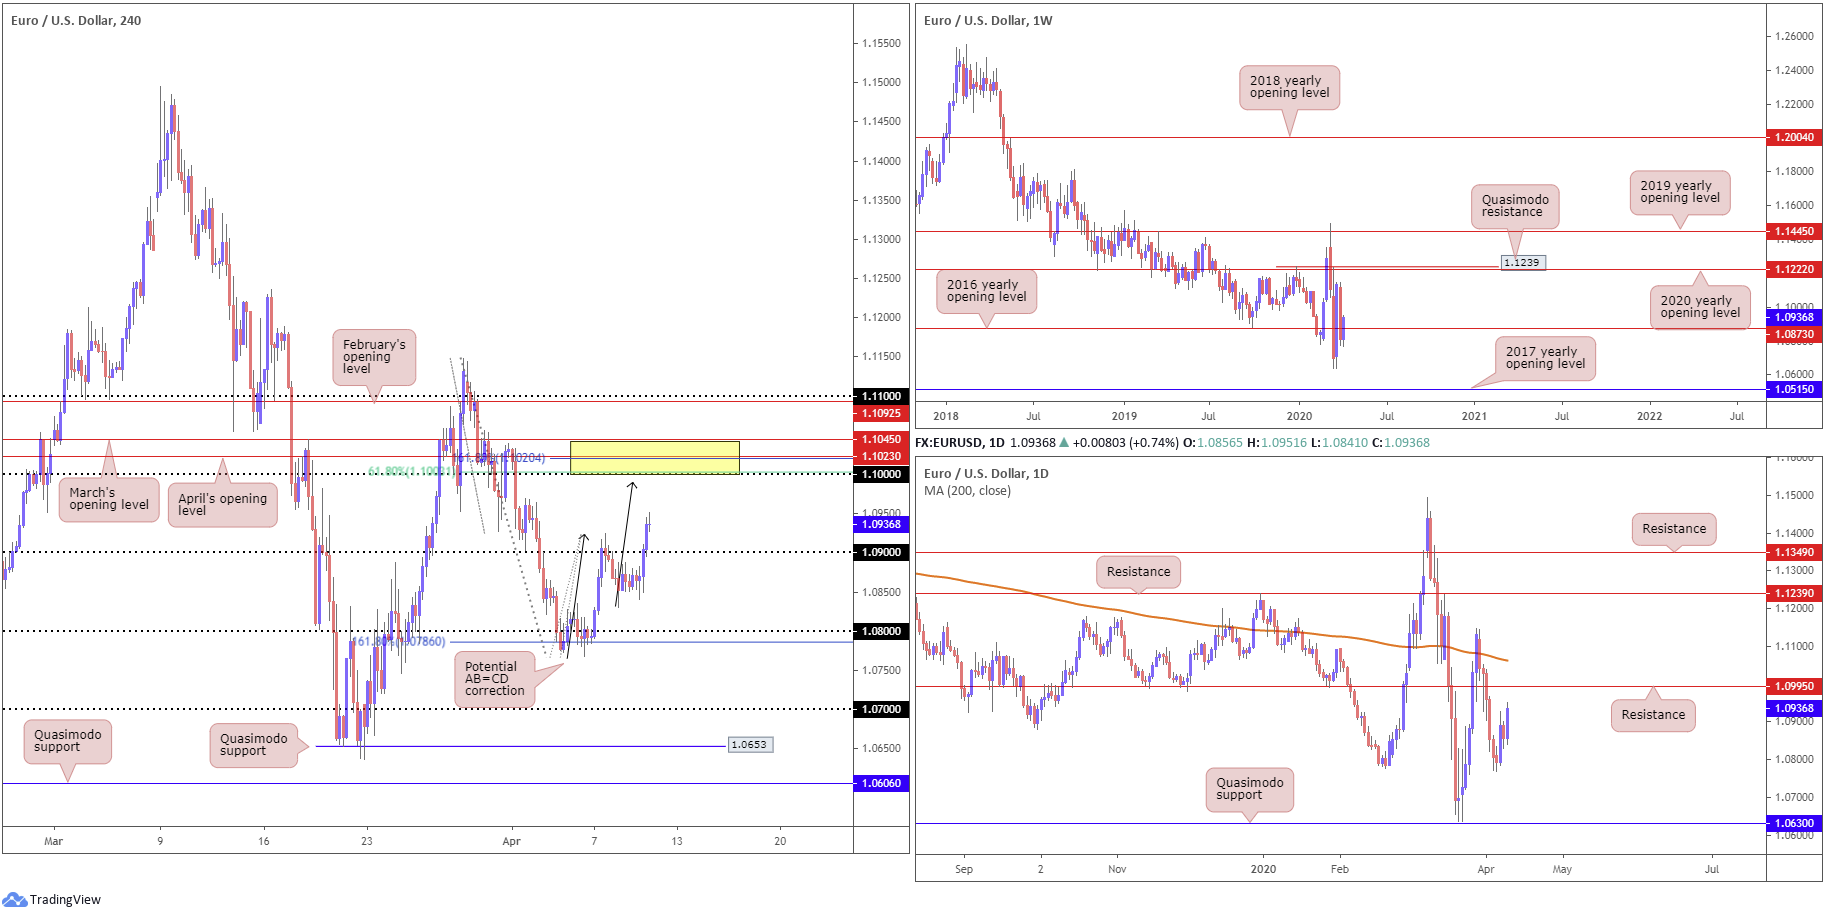
EUR/USD:
EUR/USD accelerated to the upside Thursday, guided by the US dollar index abandoning its 100.00 handle on the back of another record rise in the number of US initial claims and further easing measures by the Federal Reserve.
H4 chart studies has price establishing position north of 1.09, a touch off session highs around the 1.0950 value. While a retreat back to 1.09 may take shape, the 1.1045/1.10 (yellow) area of resistance could act as a magnet to price and pull things higher. 1.1045/1.10 is comprised of March and April’s opening levels at 1.1045 and 1.1023, a 161.8% Fibonacci extension point at 1.1020, a 61.8% Fibonacci retracement at 1.1003 and the key figure 1.10.
Higher on the curve, based on the weekly timeframe, we can see price action overthrew the 2016 yearly opening level at 1.0873. Skies beyond here are reasonably clear for a run to the 2020 yearly opening level at 1.1222, shadowed by a Quasimodo resistance at 1.1239. From the daily timeframe, however, resistance resides at 1.0995, followed by the 200-day SMA (orange – 1.1062).
Areas of consideration:
The H4 resistance at 1.1045/1.10, as aired above, contains a number of key levels, therefore potentially making it a point of interest for many traders today. What’s also notable, though, is we have a possible H4 AB=CD correction in motion which terminates around 1.0991. In addition, daily resistance at 1.0995 converges closely, adding to its bearish presence. Both levels form a few points south of the current H4 resistance area.
Should we pullback from current prices, a retest at 1.09 is feasible which could, owing to room seen on the higher timeframes to advance, also provide a platform for buyers today.
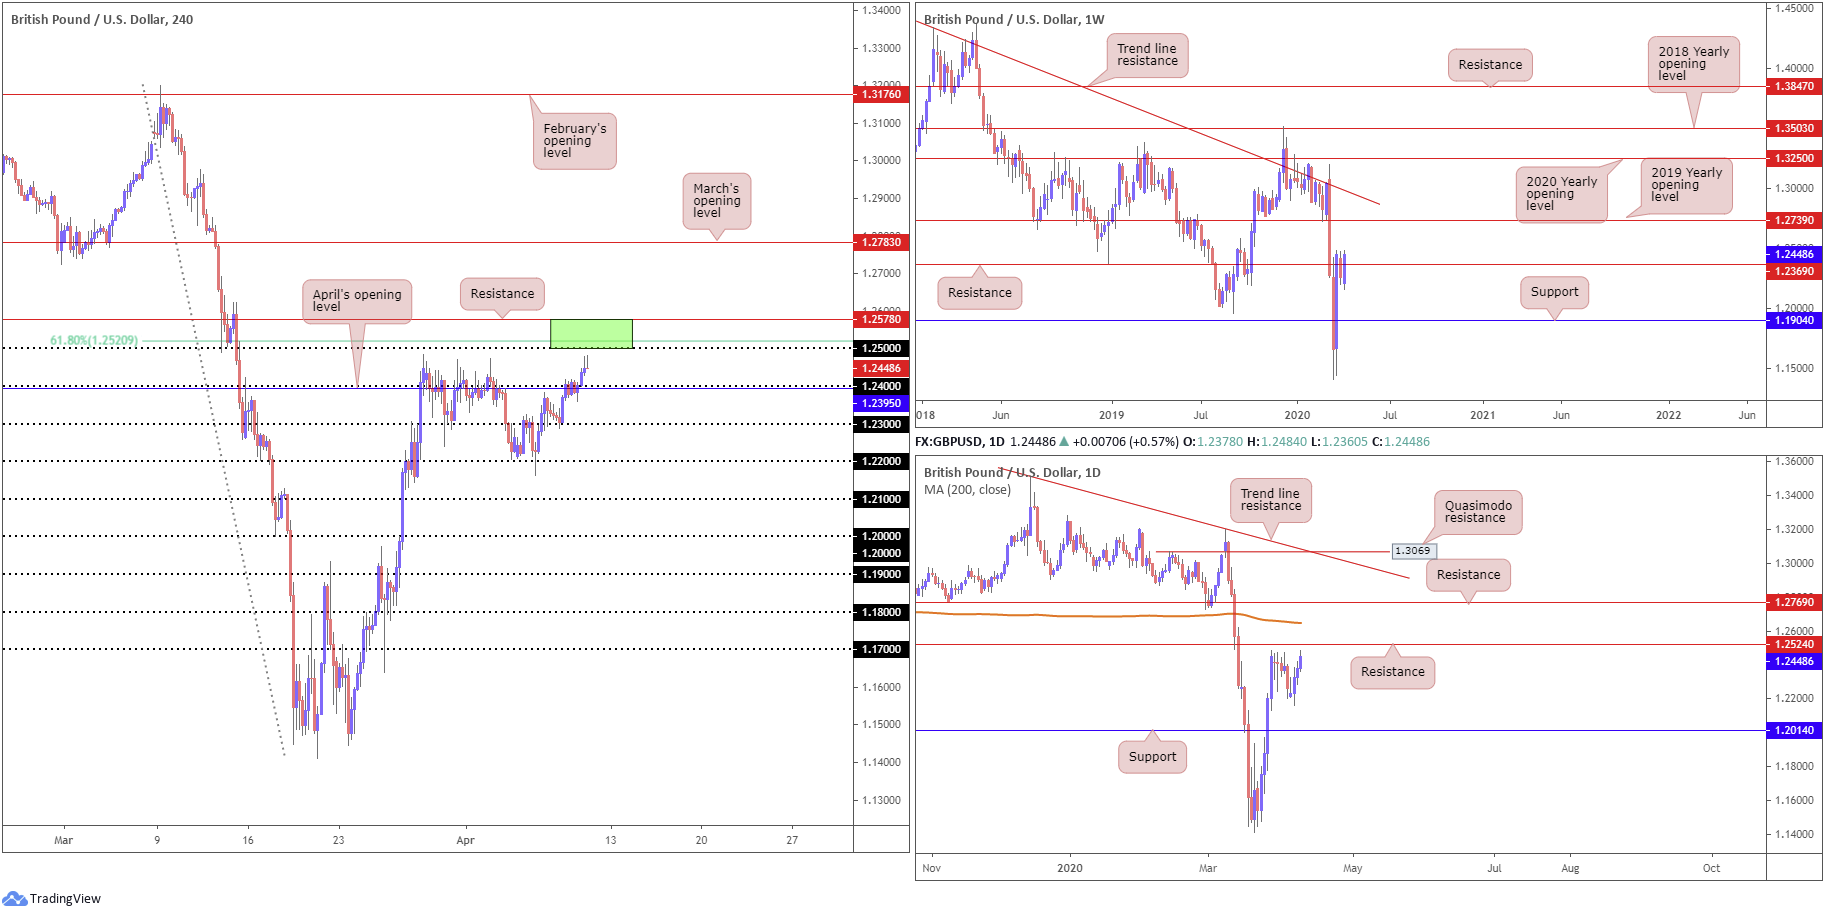
GBP/USD:
With the US dollar index sustaining another steady depreciation against major peers, the British pound found a footing and conquered 1.24 and April’s opening level at 1.2395 Thursday, lifting GBP/USD to highs south of the 1.25 handle. Note also that 1.25 comes together with a 61.8% Fibonacci retracement at 1.2520. This remains an interesting technical base, having seen the daily timeframe also plot resistance around 1.2524.
From the weekly timeframe, longer-term flow has submerged resistance at 1.2369, with the possibility of 1.2739 making an appearance, the 2019 yearly opening level, followed closely by long-term trend line resistance, taken from the high 1.5930. Beyond the noted daily resistance at 1.2524, it’s also worth pointing out we have a 200-day SMA (orange – 1.2649) nearby.
Areas of consideration:
1.25, based on the H4 timeframe, might be significant. Not only does it come with a 61.8% Fibonacci retracement at 1.2520, daily resistance at 1.2524 is also seen. However, given 1.2524/1.25 is a relatively tight range, susceptible to whipsaws, sellers interested in this zone will also likely include H4 resistance coming in at 1.2578 (green). 1.24, according to chart studies presented here, represents a logical downside target.
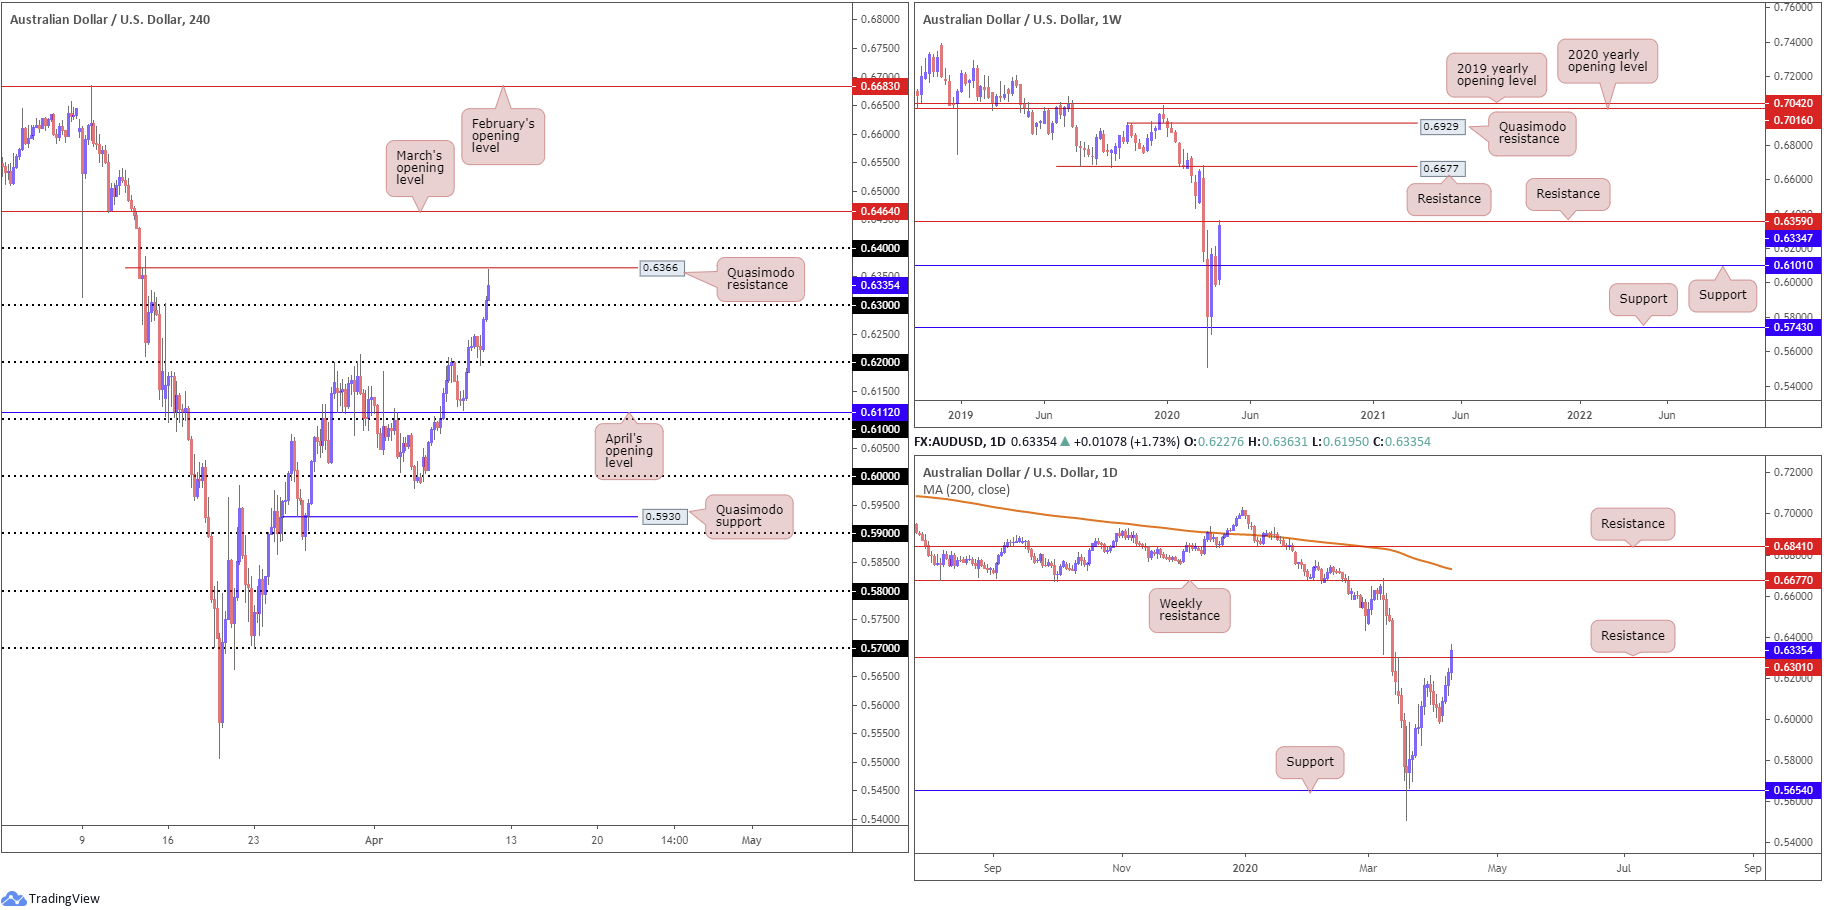
AUD/USD:
The Australian dollar gleaned weighty support on the back of the dollar’s demise Thursday, following dismal US unemployment claims data. AUD/USD gained for a fourth successive session, cleaning orders from 0.63 on the H4 timeframe and reaching Quasimodo resistance formed from 0.6366. Traders will also note the 0.64 handle lurks a touch above this base.
On a wider perspective, although the week is putting up healthy gains, we’re coming off weekly resistance priced in at 0.6359. The story on the daily timeframe, however, can see the bulls attempting to dethrone resistance at 0.6301. A decisive close above this base certainly places a question mark on the validity of weekly resistance at 0.6359. In fact, this could be the forerunner to moves towards weekly resistance at 0.6677 – the next upside target on the weekly timeframe.
Areas of consideration:
Having noted weekly resistance at 0.6359 elbowing its way into the spotlight, along with H4 Quasimodo resistance at 0.6366, the possibility of moves through the 0.63 handle towards 0.62 is certainly feasible. Assuming this comes to fruition, this could mean the break of daily resistance at 0.6301 may have simply been a whipsaw to trip buy-stop liquidity to fund moves lower.
Conservative sellers may wait and see if price has enough oomph to dive through 0.63 before committing; others may feel waiting for a H4 bearish candlestick pattern to form might suffice. Either way, the 0.62 handle offers a logical (initial) downside target to work with.
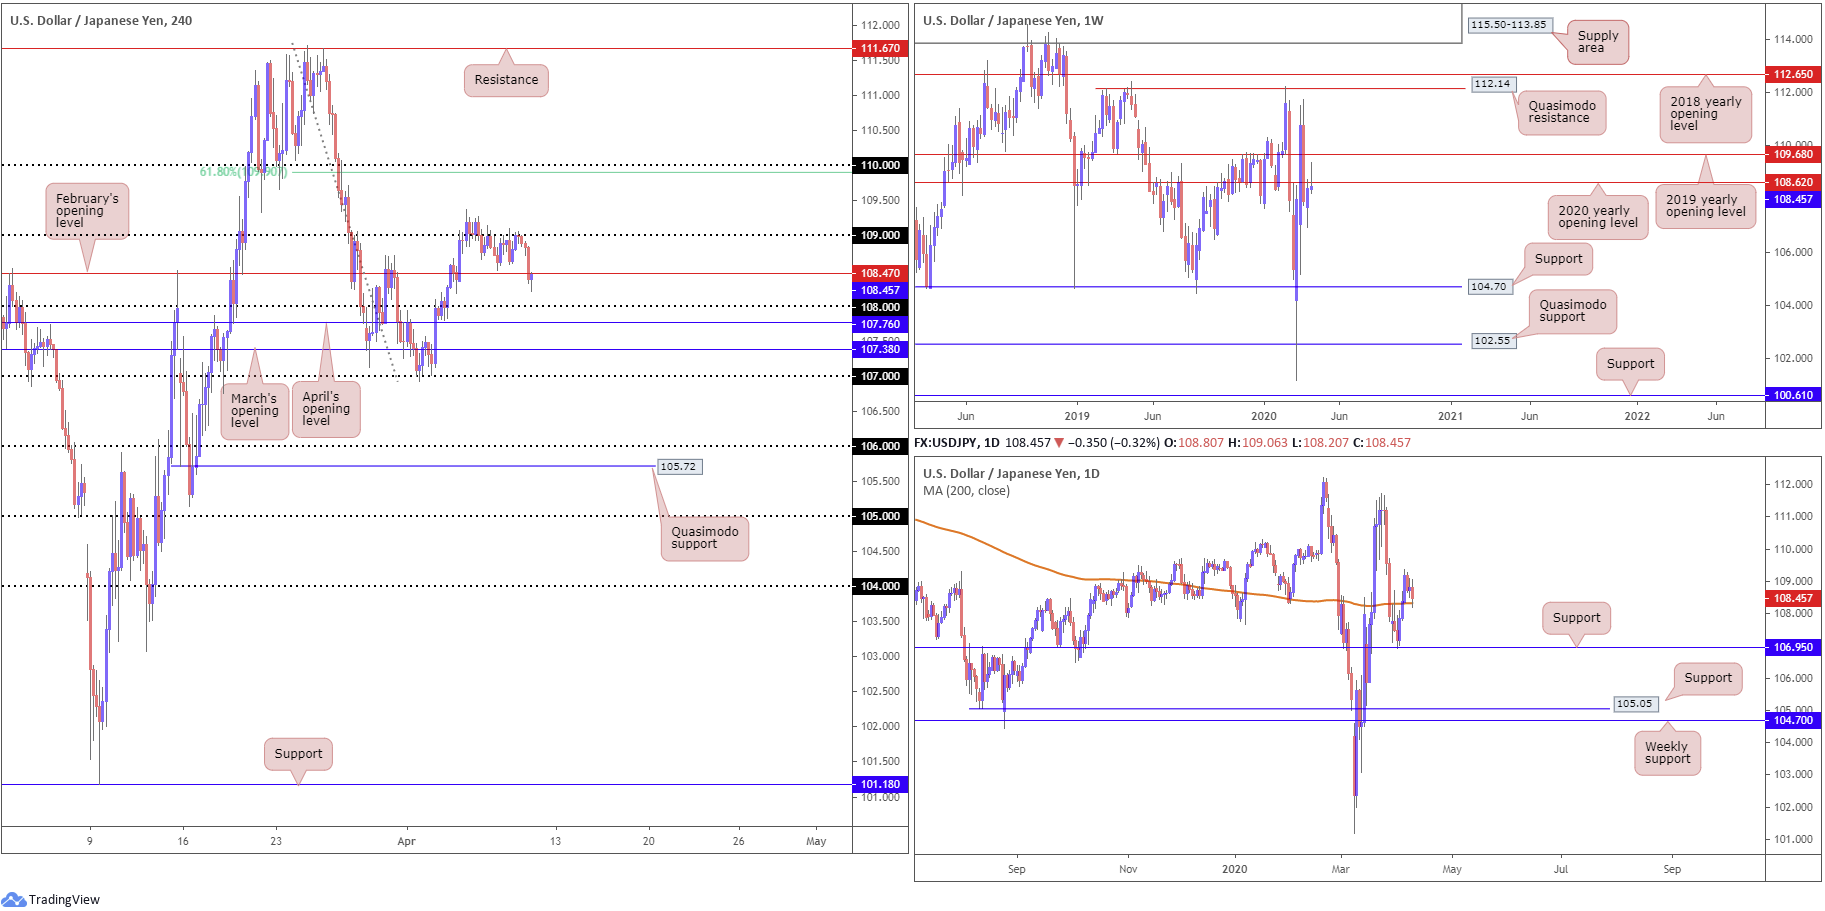
USD/JPY:
Kicking things off from the top this morning, weekly price is in the process of completing a clear-cut shooting star candlestick configuration, seeking ground south of the 2020 yearly opening level at 108.62. Conversely, the pair also recently shook hands with a 200-day SMA (orange – 108.35) on the daily timeframe, which could certainly hamper downside on the weekly chart. Should we conquer the said SMA value, nonetheless, traders will be watching for price to make a run for support coming in at 106.95.
Across the page on the H4 timeframe, alongside the US dollar index crumbling through 100.00, USD/JPY held ground beneath 109 and dipped a toe in waters south of February’s opening level at 108.47. As of current price, the unit is seen retesting the underside of 108.47, with the possibility of continued downside towards 108. March and April’s opening levels at 107.38 and 107.76, respectively, are in place in the event we cross 108 today.
Areas of consideration:
While daily price is nursing losses off the 200-day SMA, higher-timeframe movement usually takes precedence. As such, weekly price holding its stance beneath 108.62 may be enough to entice further selling.
February’s opening level at 108.47, therefore, is a potential contender for resistance today, though sellers may also want to pencil in the possibility of a fakeout forming to 108.62 on the weekly timeframe before serious sellers step in. As underlined above, 108 offers an initial downside target, with the possibility of moves to 107.76 and 107.38 on the H4 timeframe.
The accuracy, completeness and timeliness of the information contained on this site cannot be guaranteed. IC Markets does not warranty, guarantee or make any representations, or assume any liability regarding financial results based on the use of the information in the site.
News, views, opinions, recommendations and other information obtained from sources outside of www.icmarkets.com.au, used in this site are believed to be reliable, but we cannot guarantee their accuracy or completeness. All such information is subject to change at any time without notice. IC Markets assumes no responsibility for the content of any linked site.
The fact that such links may exist does not indicate approval or endorsement of any material contained on any linked site. IC Markets is not liable for any harm caused by the transmission, through accessing the services or information on this site, of a computer virus, or other computer code or programming device that might be used to access, delete, damage, disable, disrupt or otherwise impede in any manner, the operation of the site or of any user’s software, hardware, data or property.