USD/CNH Price Analysis: Yuan overbought for first since March 2018
![]()
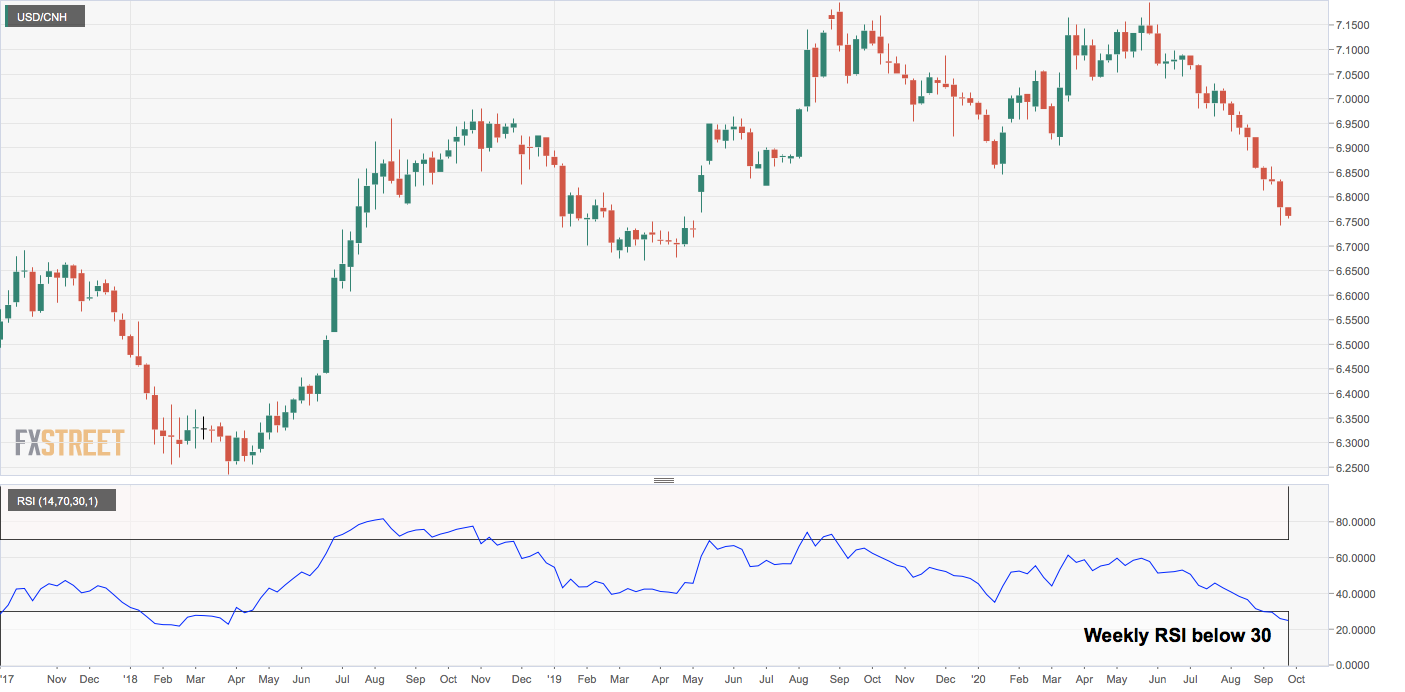
- USD/CNH’s weekly chart indicator shows CNH’s rally is overdone.
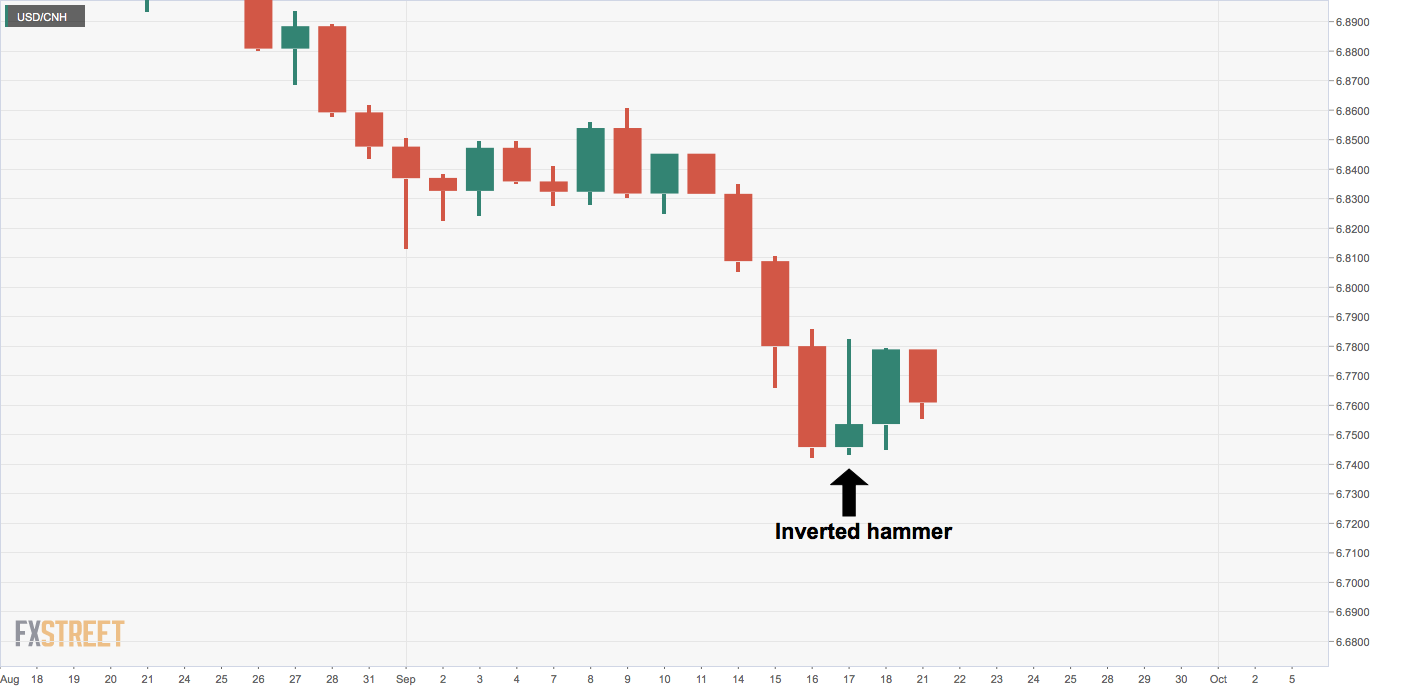
- The pair’s daily chart also favors a corrective bounce.
The USD/CNH pair may be in for consolidation or minor bounce, as the offshore yuan or CNH looks overbought for the first time in over two years.
USD/CNH’s 14-week relative strength index (RSI) has declined below 30, a sign of oversold conditions. A sub-30 reading was last seen in March 2018.
The daily chart is also reporting oversold conditions for the third straight week. An oversold reading on the RSI implies the sell-off is overdone. However, the oversold reading needs validation from signs of downtrend exhaustion on the price chart.
The pair created an inverted hammer last Thursday, indicating seller fatigue and potential for reversal higher.
All-in-all, the odds appear stacked in favor of a corrective bounce. The immediate resistance is seen at 6.8135 (Sept. 1 low) followed by 6.9048 (March 9 low). Meanwhile, support is seen at 6.7423 (Sept. 16 low).
Weekly chart
Daily chart
Trend: Oversold