GBP/USD Price Analysis: Bears can ignore pullback beyond 1.2800
![]()
- GBP/USD retraces from the lowest in one week to regain 1.2800.
- Bearish MACD, monthly falling trend line keeps the sellers hopeful.
- Two-month-old horizontal support becomes the key, 1.3010/15 adds to the upside barriers.
GBP/USD bounces off an intraday low of 1.2803 to 1.2817 during Tuesday’s Asian session. In doing so, the Cable traders trim the previous day’s losses.
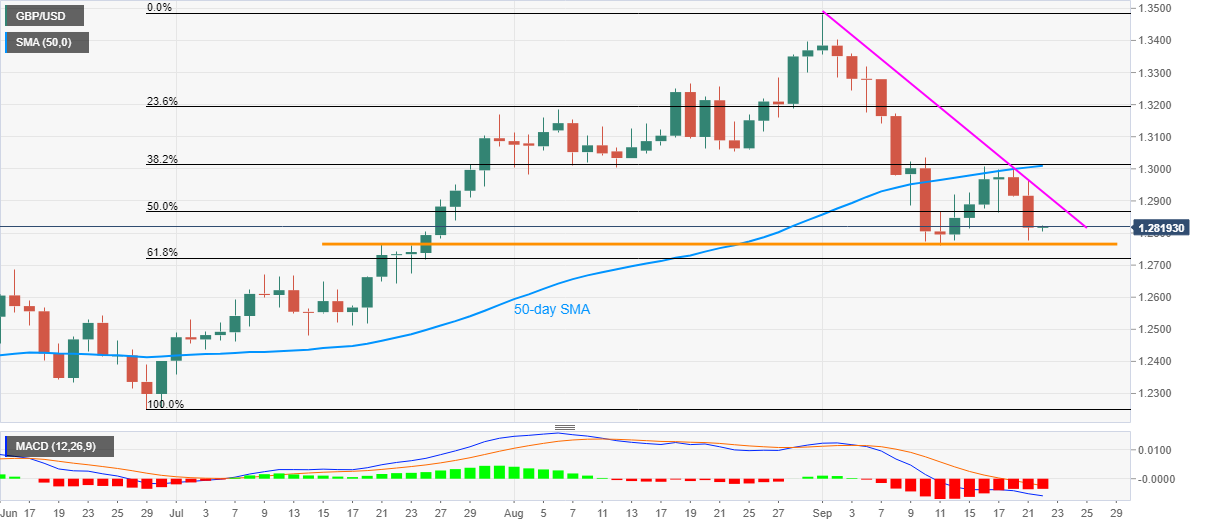
However, bearish MACD pushes the buyer to take entries only on the break of a descending trend line from September 01, currently around 1.2930.
It should also be noted that a confluence of 38.2% Fibonacci retracement of June-September upside and 50-day SMA around 1.3010/15 will challenge the bulls afterward.
Meanwhile, a horizontal area comprising July 21 top and the monthly low, between 1.2762 and 1.2767, provides crucial support to the pair.
Also acting as downside barriers are the 61.8% Fibonacci retracement level and July 09 high, respectively close to 1.2720 and 1.2670.
GBP/USD daily chart
Trend: Bearish