Ethereum and Bitcoin poised for a short-term rebound before further losses
![]()
- Ethereum is currently trading at $342 after defending the $331 level.
- Bitcoin is trading sideways, waiting for clarity in the short-term.
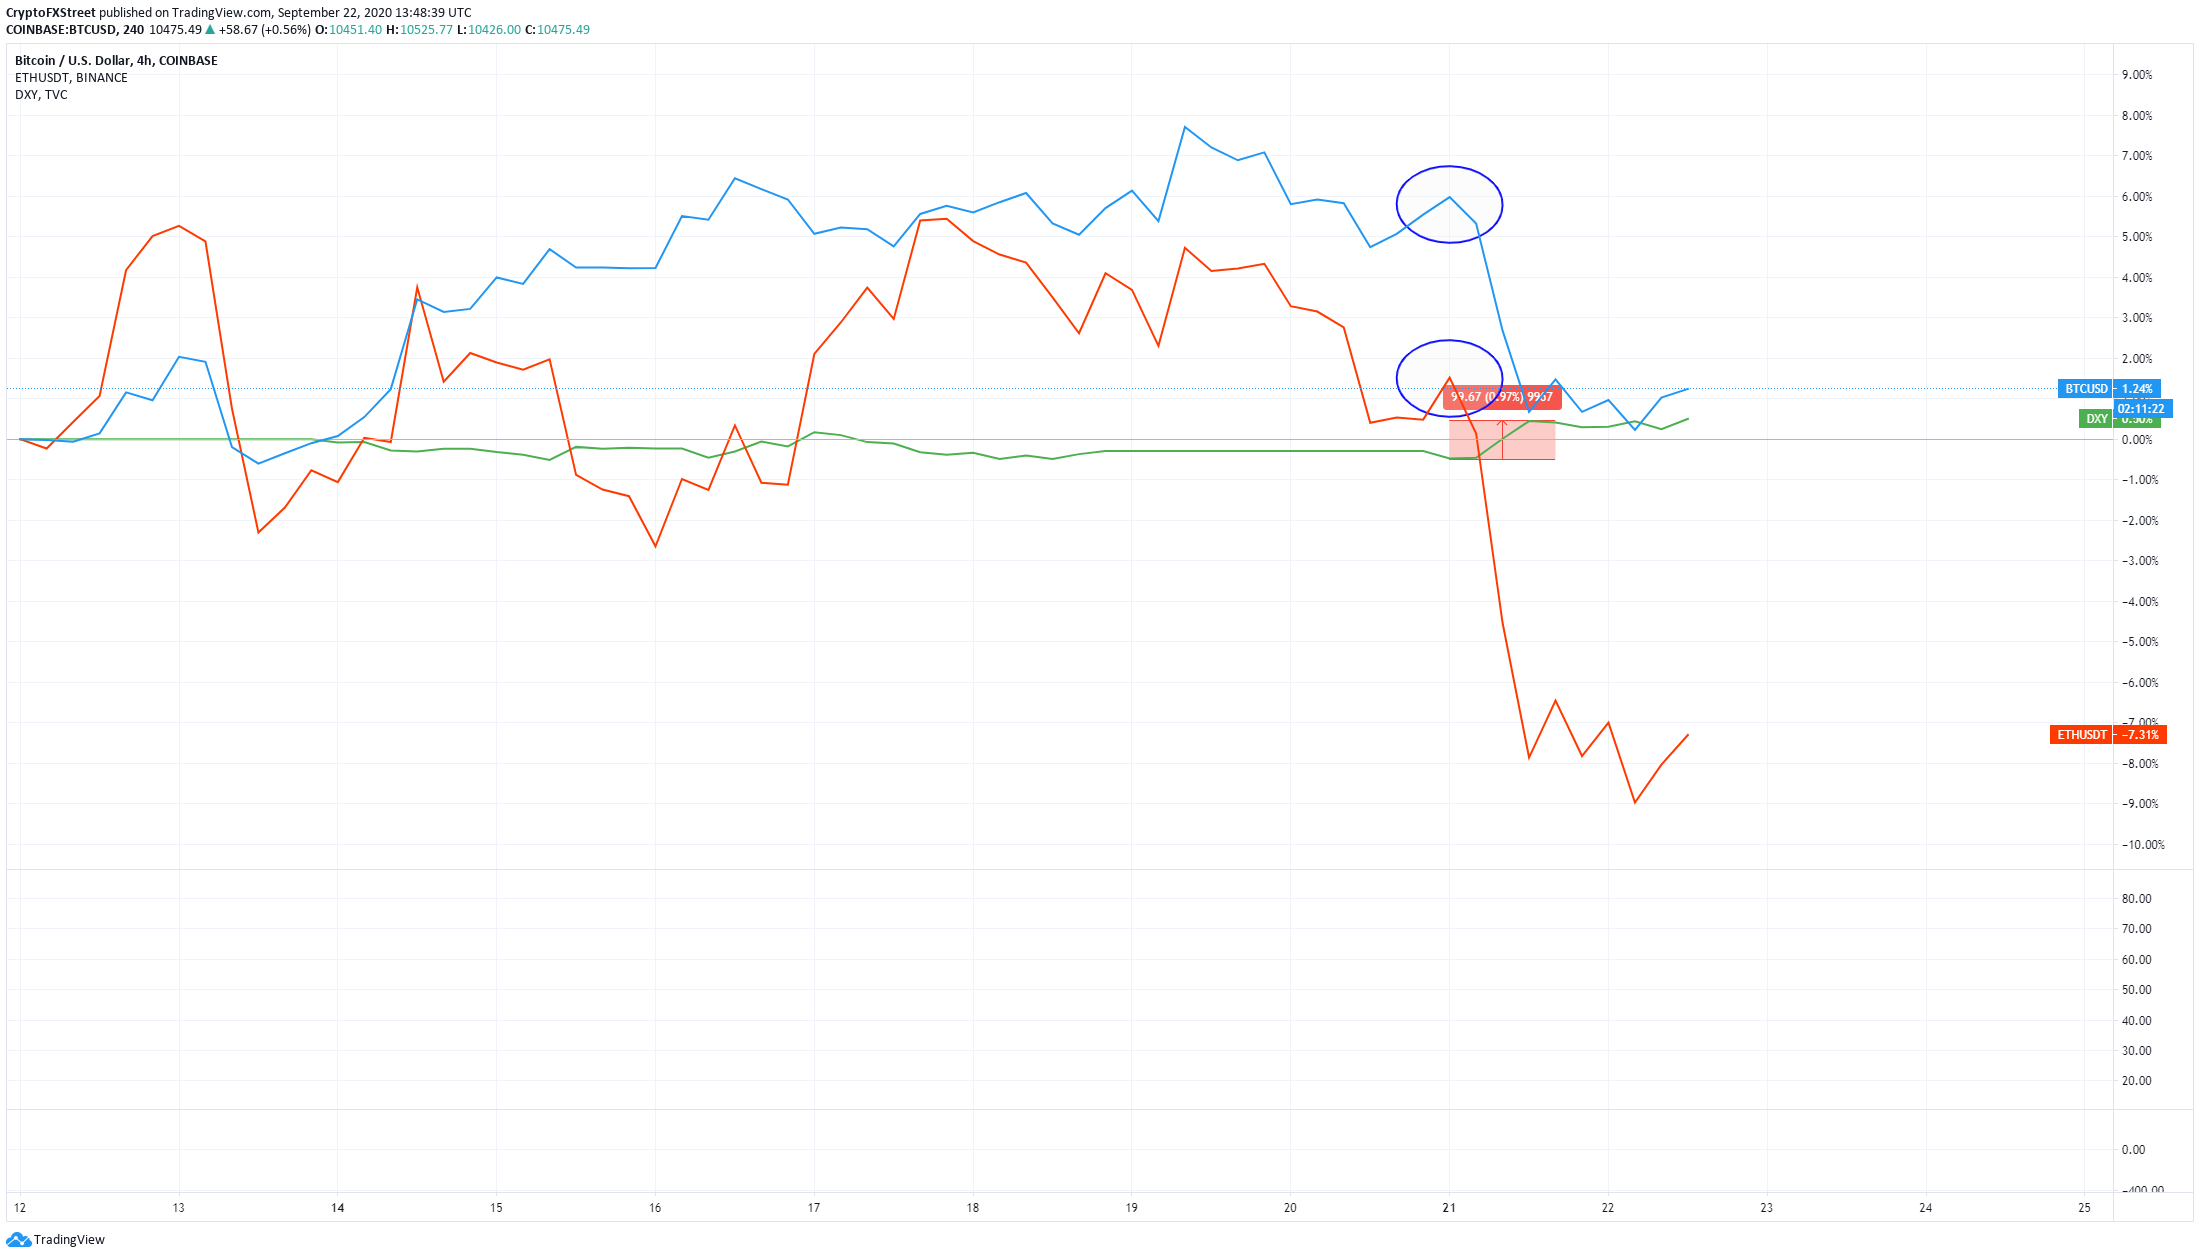
Both Ethereum and Bitcoin slipped below significant support levels after the U.S. Dollar had a notable rally. The entire crypto market has been inversely correlated with the dollar Index and directly correlated with the stock market.
BTC/USD 1-hour chart
-637363826369004333.png)
It seems that Bitcoin is bouncing back up on the 1-hour chart after defending a support level at $10,357, establishing a higher low at $10,359, just $2 above the previous one. Bitcoin’s price has now also climbed above the 21-EMA and eying up the last resistance level at $10,534.
BTC/USD 15-minutes chart
-637363826527607035.png)
BTC price has created an uptrend here, climbing above the 50-SMA and using it as a support level afterward. In the short-term, it seems that the flagship cryptocurrency is poised for a rebound above $10,534 but remains in a downtrend on the longer-time frames.
ETH/USD 1-hour chart
-637363826703711593.png)
The smart-contracts giant has formed a symmetrical triangle pattern as the upper and lower trendlines meet at the apex on the right side; however, although these patterns serve as a continuation of the current trend, Ethereum bulls are using it as a reversal indicator. ETH’s price just pierced through the upper trendline and is seeing some mild continuation, although getting stopped at the 20-SMA.
ETH/USD 15-minutes chart
-637363826949835001.png)
On the 15-minutes chart, Ethereum price has established an uptrend, and it’s eying up $348 as the next resistance level.
ETH IOMAP Chart
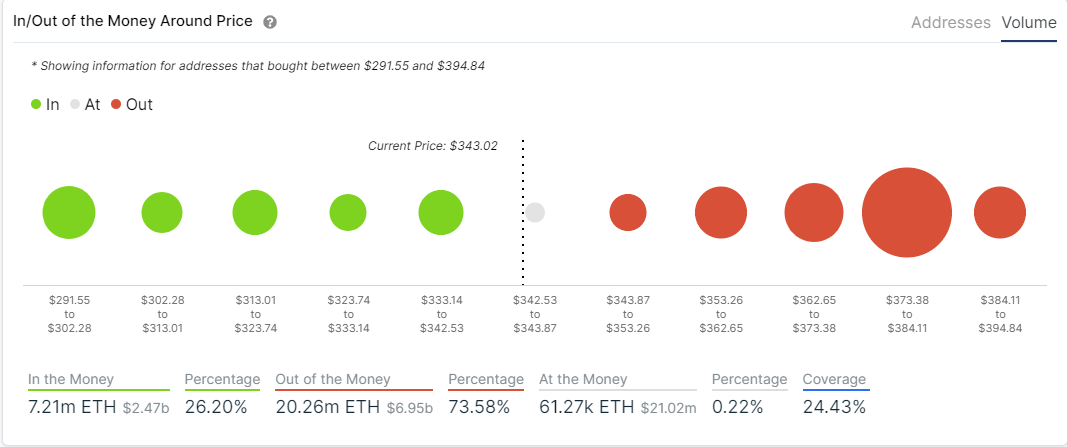
According to the In/Out of the Money Around Price chart provided by IntoTheBlock, the next cluster of addresses that bought ETH is found at $348 but only has a volume of 690,000 ETH is lower than the cluster of support at $339 with 1,420,000 ETH in volume.