Cardano Price Prediction: ADA poised for a steep correction despite the current uptrend
![]()
- ADA is currently trading at $0.10 after a rejection from a resistance level at $0.114 on October 13.
- The TD sequential indicator has presented a strong sell signal for ADA in the 3-day chart.
Cardano had a notable slip from $0.11 to a low of $0.101 on October 19, before finally recovering two days later. Unfortunately, it seems that the digital asset has crashed again, breaking the last support level established on October 19.
ADA facing intense selling pressure
Looking at the 3-day chart, we can observe a robust sell signal presented by the TD sequential indicator, which seems to be getting enough continuation in the past 24 hours as the price of ADA fell by close to 5%.
ADA/USDT 3-day chart
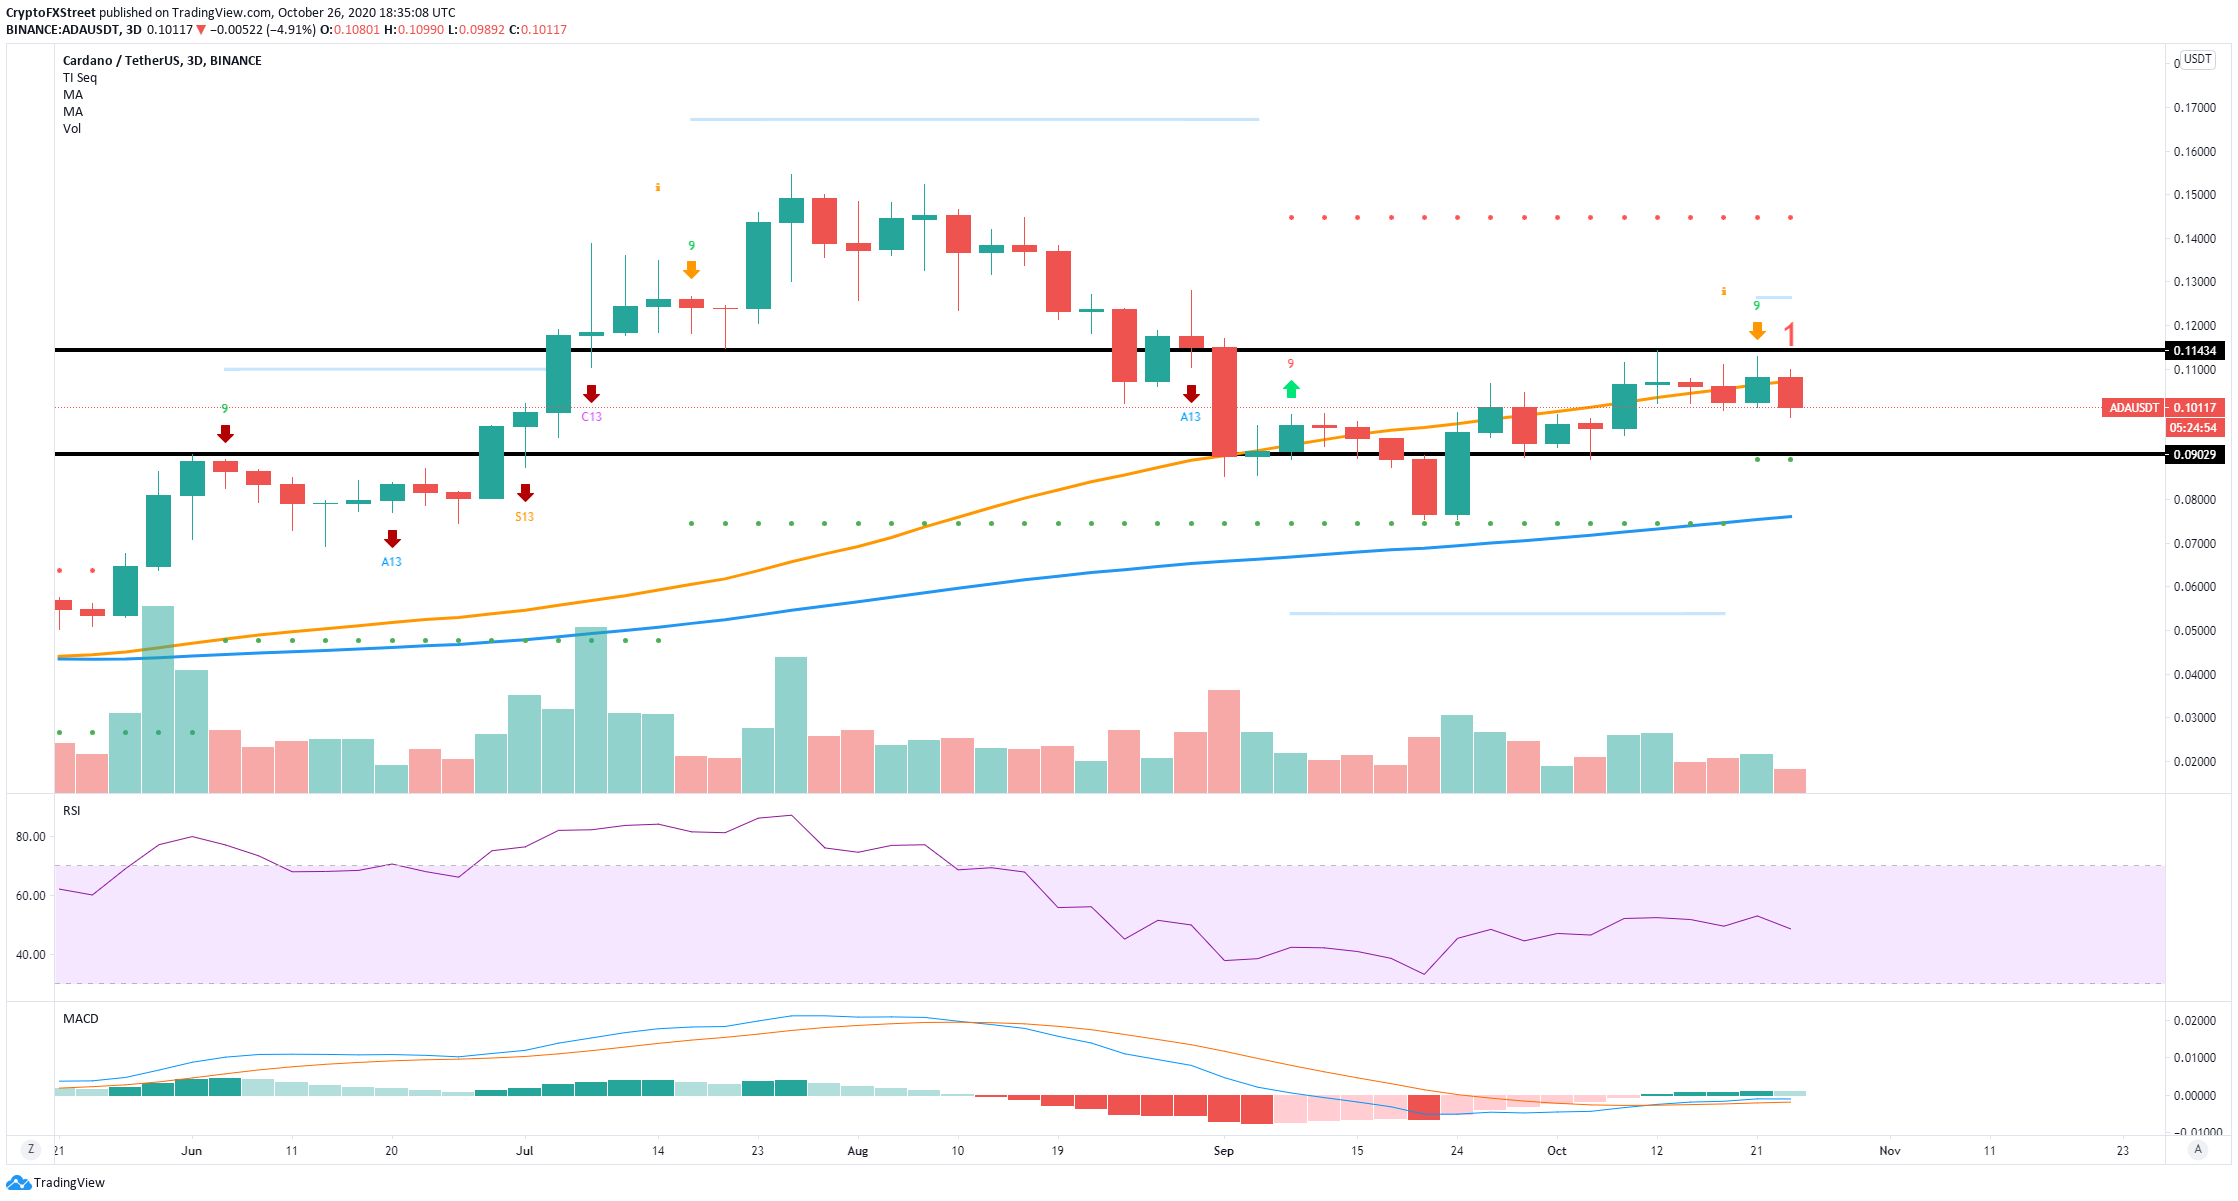
Additionally, the 50-SMA is acting as a healthy resistance level, having rejected ADA’s price several times in the past month. The next support level is located at $0.09, a price target for the bears if selling pressure continues to mount.
ADA IOMAP Chart
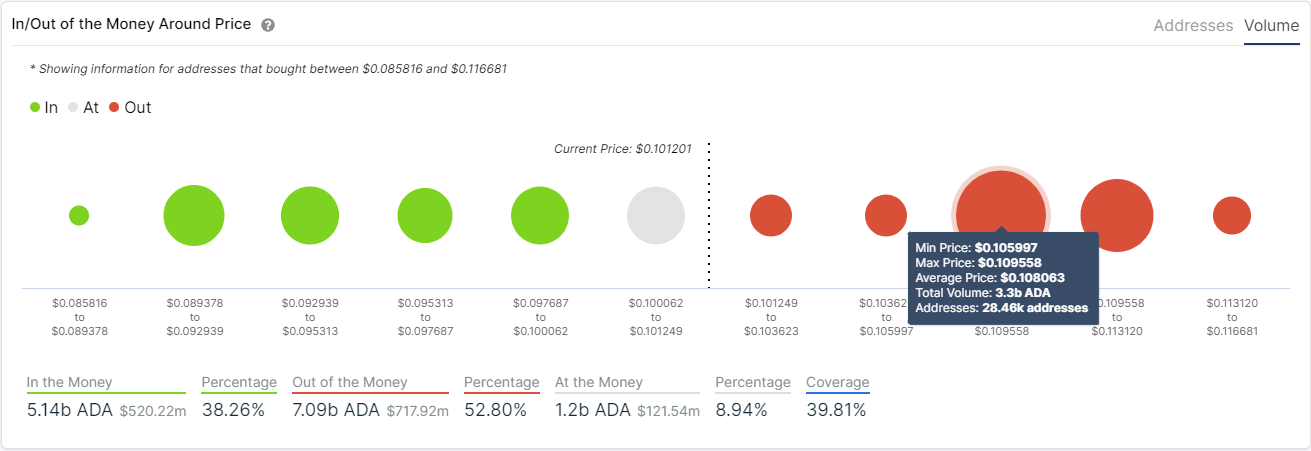
The In/Out of the Money Around Price chart seems to confirm the bearish scenario, showing a strong resistance area between $0.105 and $0.109. We can also observe very little support to the downside when compared to the opposition above.
Cardano tries to hold a critical support level to continue with its uptrend
Despite the selling pressure that Cardano faces, bulls are currently defending a critical support level on the daily chart to avoid losing the current uptrend. The 50-SMA is also acting as a robust support point around $0.980.
ADA/USDT daily chart
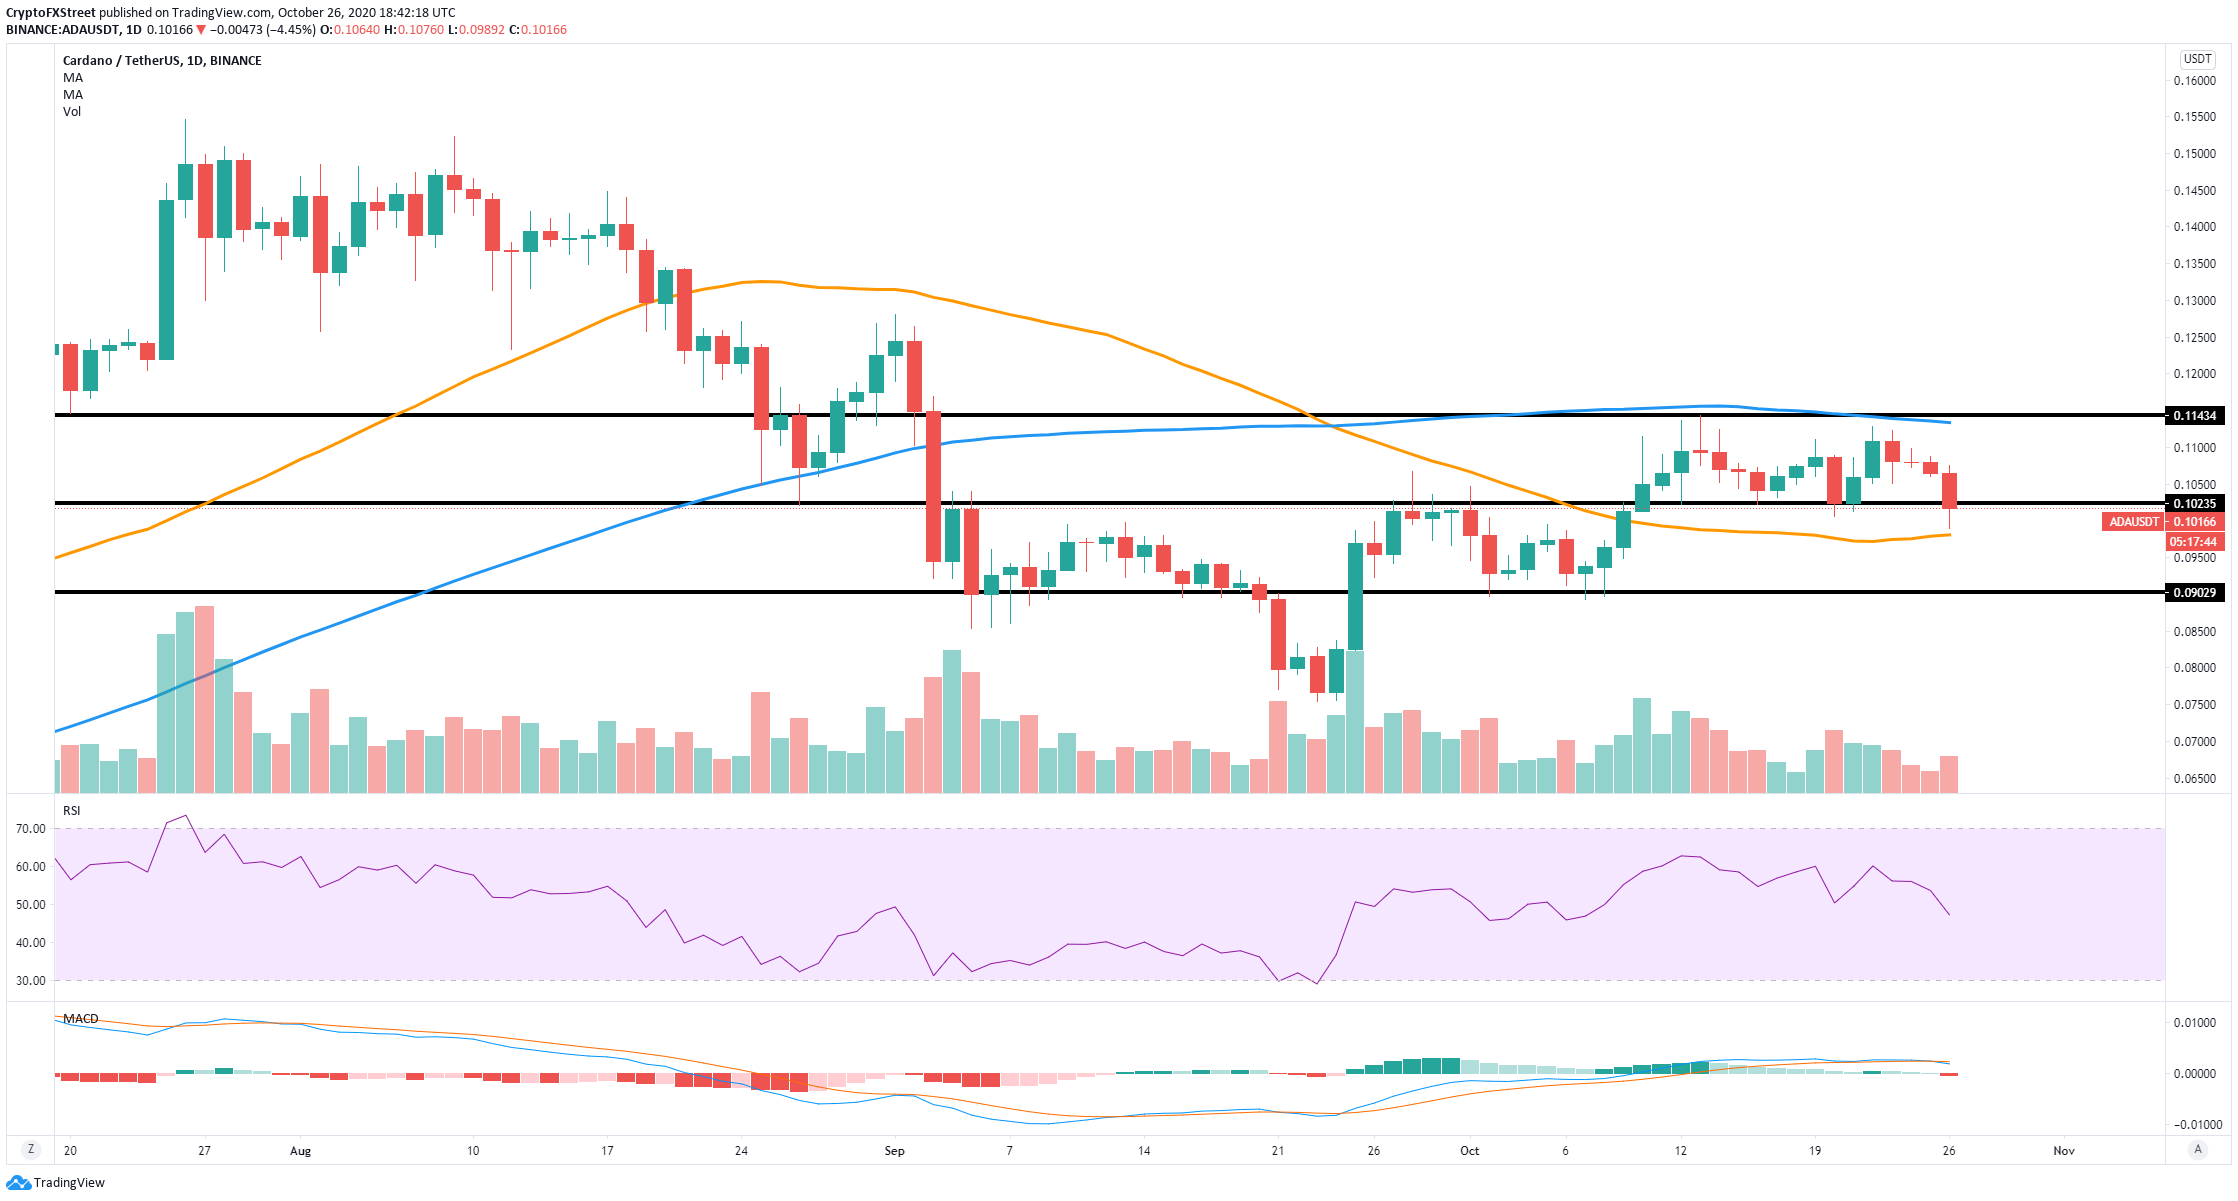
A rebound from the 50-SMA can easily drive ADA’s price towards the resistance level at $0.1143, which coincides with the 100-SMA. A breakout above this point can push Cardano as high as $0.1280.