USD/CAD Weekly Forecast: is the US dollar this weak?
![]()
- West Texas Intermediate finish at $45.72 up 6.75% on the week, 27.35% in November.
- Wednesday WTI close of $45.82 highest since March 6.
- USD/CAD ends at its weakest point since January 6.
- Markets still punishing the US dollar for COVID-19 in the states.
- FXStreet Forecast Poll looks to consolidation near the low.
The Canadian Dollar scored a trifecta this week with crude oil prices rising to their best level since the March pandemic advent, favorable technical indicators and the continuing aversion to the American currency from the still rising COVID-19 count in the United States.
West Texas Intermediate (WTI) cleared 6.75% on the week but it was Tuesday’s 4.57% jump from $42.93 to $44.89 that prompted the largest drop in the USD/CAD which shed 81 points to finish at 1.3000. Crude prices have reached their highest point since plunging through $46 in early March.
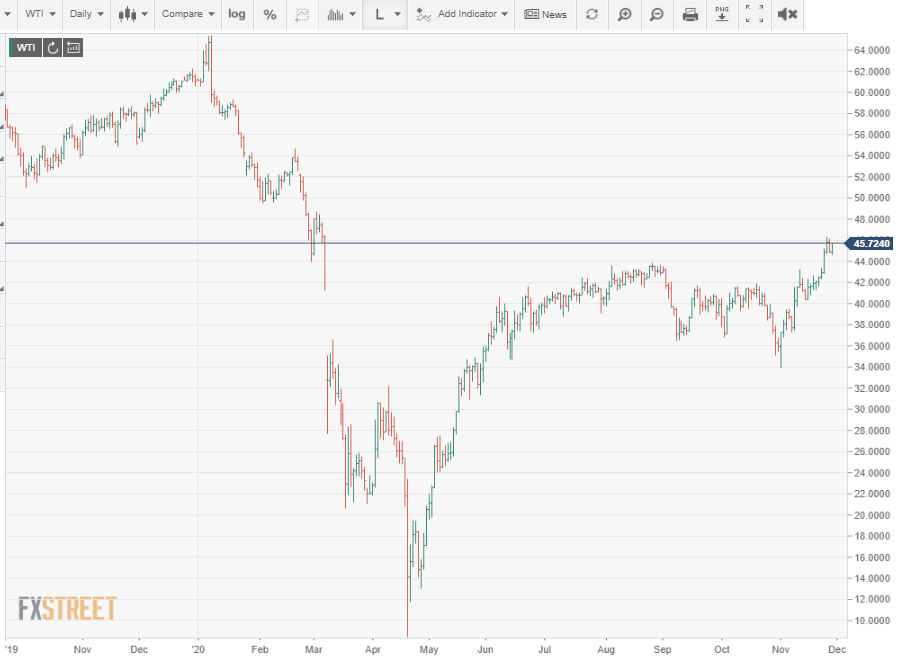
Expectations that the OPEC and Russian production cuts enacted last year will be extended through the end of the first quarter and a growing conviction that a global economic recovery will commence sometime in the spring have brought WTI back to the pandemic start line.
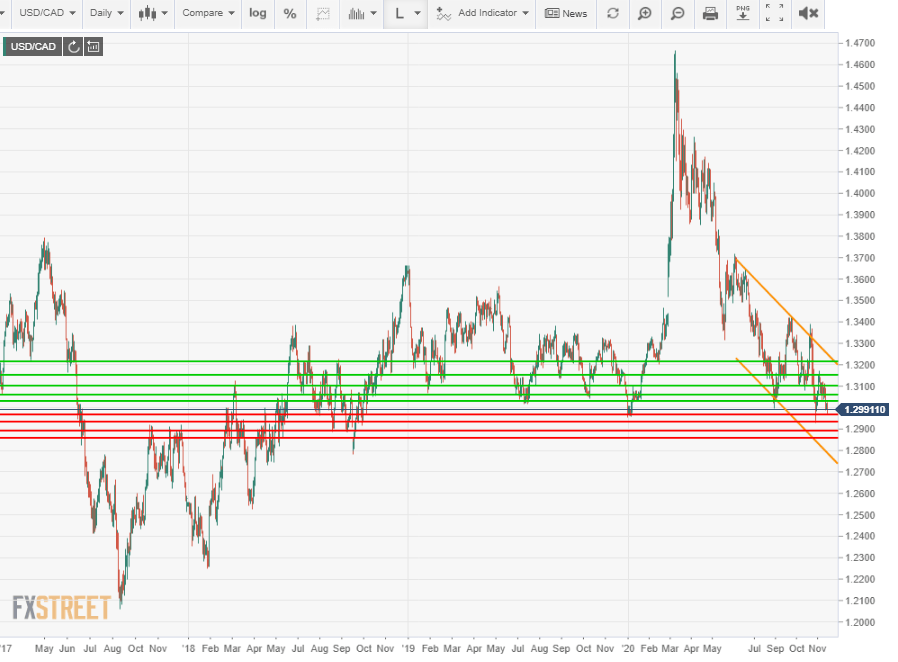
Technical indicators continue to point the USD/CAD lower. The six-month old descending channel is intact and the scarcity of support lines below 1.3000 and the plenitude above add practical trading pressure to the decline.
 Finally, markets fear that the continuing climb in COVID-19 diagnoses and hospitalizations in the US and the concomitant business and personal restrictions in some but by no means all states, may have reversed labor market improvements.
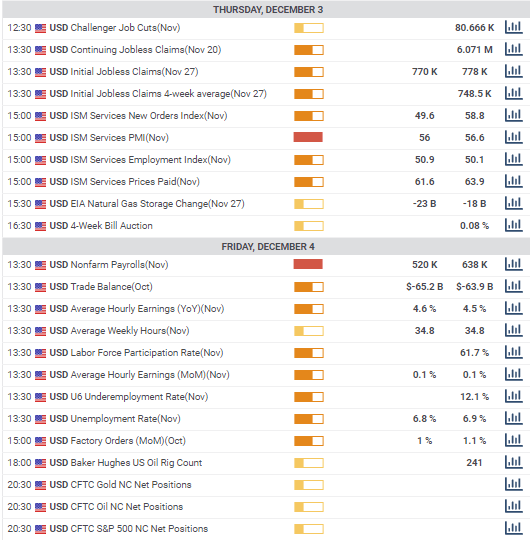
Initial Jobless Claims have increased from 711,00 to 778,000 in the last two weeks. While this is not the only or the largest jump in the eight months of the pandemic, it is only one coordinated with a specific cause.
The Canadian economy through October had restored 78.8% of the spring jobs losses, the US 54.4%. The US unemployment rate was 6.9% last month, in Canada it was 8.9%.
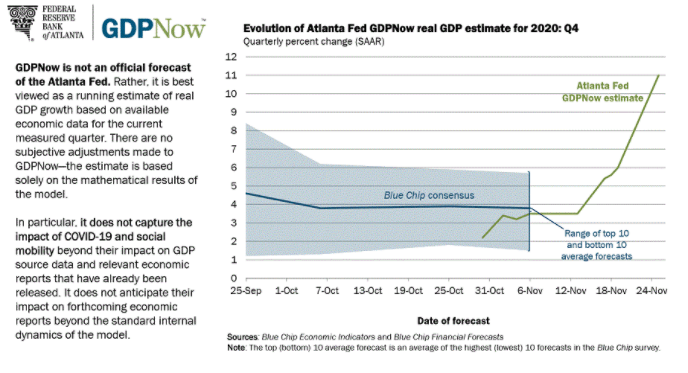
Even though the fears over the new lockdowns in the US appear vastly overstated, the Atlanta Fed estimates annualized growth is 11% in the fourth quarter, markets have yet to escape the psychological fetters of the spring panic.
 The US dollar has continued lower as much out of habit as fact. The responses in the USD/JPY, and USD/CHF, pairs with safety status on the currency side, to the Pfizer vaccine trial on November 9 and the Markit PMI figures on November 23, with strong ascents, show the likely dollar direction when the pandemic loses its grip on the currency markets.
USD/CAD outlook
Currency markets remain dominated by the mindset of the pandemic. Even though the safety premium of the US dollar has long since been removed, markets have been unwilling to return to comparative economics while COVID-19 is prevalent. Virus diagnoses and hospitalizations are as common in Europe as the US but it is the rising cases in the states that keep the dollar moving lower.
Trading momentum is down, with support below 1.3000, such as exists, stemming from a few sessions in the first week of January. Before that the USD/CAD had not been south of 1.3000 since the late summer and fall of 2018. The brief low of 1.2928 on November 9 is unimportant.
The Canadian third-quarter GDP number on Thursday, expected to be +47.0 annualized, and employment figures on Friday that could bring the labor market restoration to over 80% could, if accurate provide the loonie with additional support. As will crude oil, especially if WTI can move above $47.
The USD/CAD should continue lower largely from the lack of any conceptual alternative. Immediate support at 1.2965 is weak as are the lower levels but the logic for continued slide is equally insubstantial. The relative tenuous nature of the decline also makes it susceptible to an unexpected reversal.
Canada statistics November23-November 27
No economic data was released this week.
 US statistics November 23-November 27
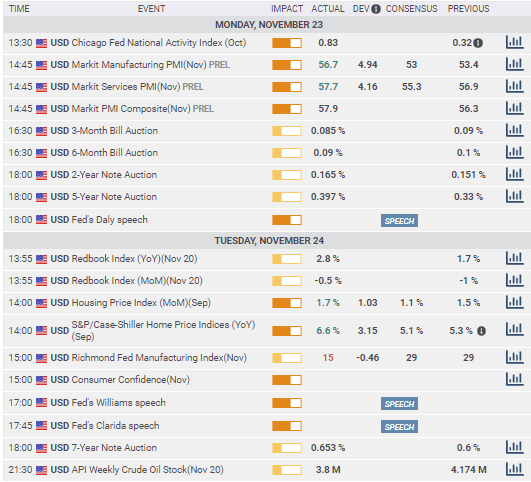
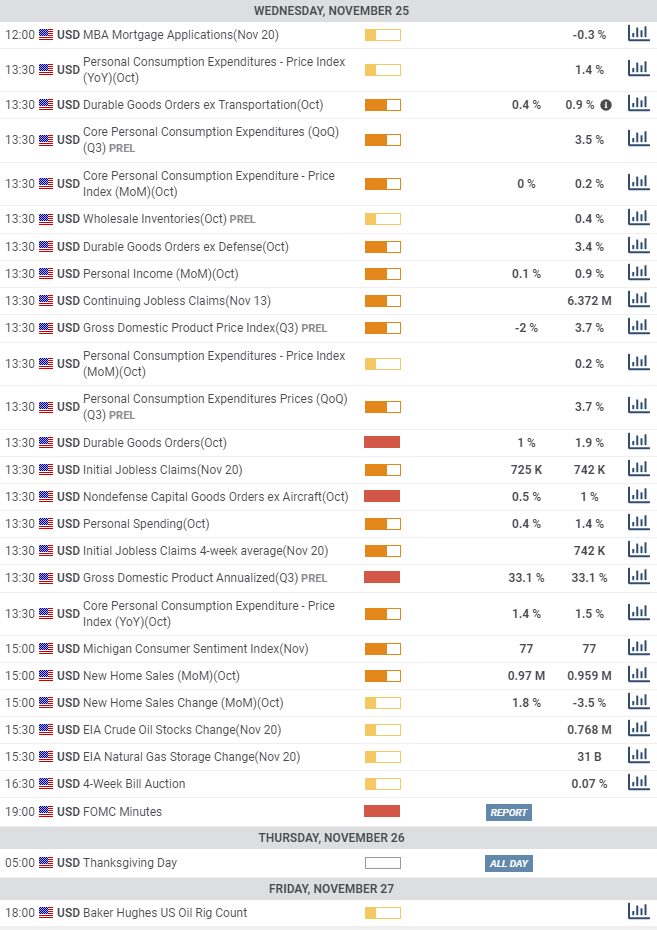
A mixed group of figures were displayed this week. Purchasing Managers’ Indexes for November were better than predicted as were Durable Goods Orders. Initial Jobless Claims rose for the second time, likely confirming the impact of new pandemic closures in some states. Consumer Confidence dropped and the housing market continued its excellent run. Third-quarter GDP confirmed the active recovery.
Markit’s Preliminary Manufacturing PMI for November was considerably better at 56.7 than its 53 forecast and October’s 53.4. It was the highest reading since September 2017. Services PMI registered 57.7 on a 55.3 prediction and the 56.9 September score. It was the highest level since March 2015. The Markit Composite PMI rose to 57.9 in November from 56.9.
Conference Board Consumer Confidence dropped to 96.1 in November from 101.4 in October.
Durable Goods orders rose 1.3% in October, ahead of the 0.9% indication and September was revised to 2.1% from 1.9%. Goods Orders ex Transportation also climbed 1.3%, more than tripling the 0.4% forecast. September’s orders almost doubled to 1.5% from 0.8% with revision. Durable Goods Orders ex Defense rose 0.2% in October after a 3.8% gain prior.
Gross Domestic Product in the third quarter expanded at a 33.1% annual pace as expected, reversing the 31.4% pandemic decline in the second. Michigan Consumer Sentiment in November was adjusted to 76.9 from 77. Personal Income in October fell 0.7%. It had been predicted to be flat after September’s 0.7% increase. Personal Spending gained 0.5% in October, 0.4% had been projected and September was revised to 1.2% from 1.4%.
New Home Sales fell 0.3% on an annualized basis to 999,000, 1.5% and 970,000 had been forecast.
The Personal Consumption Expenditures (PCE) Price Index was flat in October on a -0.1% estimate and September’s 0.2% rise. The annual rate was 1.2% after September’s 1.4%. The core PCE Price Index was flat in October from 0.2% and 1.4% on the year, down from 1.6% in September.
Initial Jobless Claims rose to 778,000 in the week of November 20 from 730,000 and 748,000 in the two previous weeks. Continuing Claims fell to 6.071 million on November 13 from 6.37 million prior.
 Canada statistics November 30-December 4
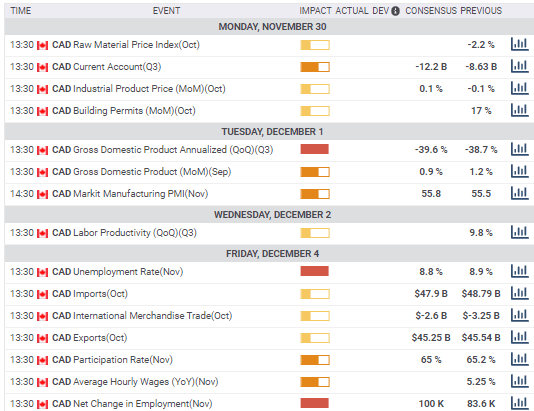
The November labor market report and third quarter GDP figures, on Tuesday and Friday are the most relevant. Each can affect trading with stronger numbers generally good for the Canadian dollar.
The Raw Material Price Index for October, which traces prices paid by Canadian manufacturers is out on Monday. This index fell 2.2% in September The Industrial Prices Index, which follow selling prices for commodity producer is forecast to be unchanged at -0.1% in October.
Gross Domestic Product (GDP) is forecast to decline 39.6% at an annualized rate in the third quarter after dropping 38.7% in the second. On the month GDP is expected to decrease 0.9% in September, following the 1.2% fall in August. Markit Manufacturing PMI for November is predicted to rise to 55.8 in November form 55.5 in October.
The Unemployment Rate in November is forecast to drop 0.1% to 8.8%. Net Change in Employment is projected to add 100,000 jobs after the 83,600 gain in October. The Participation Rate is projected to rise to slip to 65% from 65.2%. Average Hourly Wages rose 5.25% on theyear in October. Exports are forecast to fall to C$45.2 billion from C$45.54 billion and imports to drop to C$47.9 billion from C$48.79 billion. The International Merchandise Trade [balance] is expected to be -C$2.6 billion in October from -C$3.25 million in August.
 US statistics November 30 -December 4
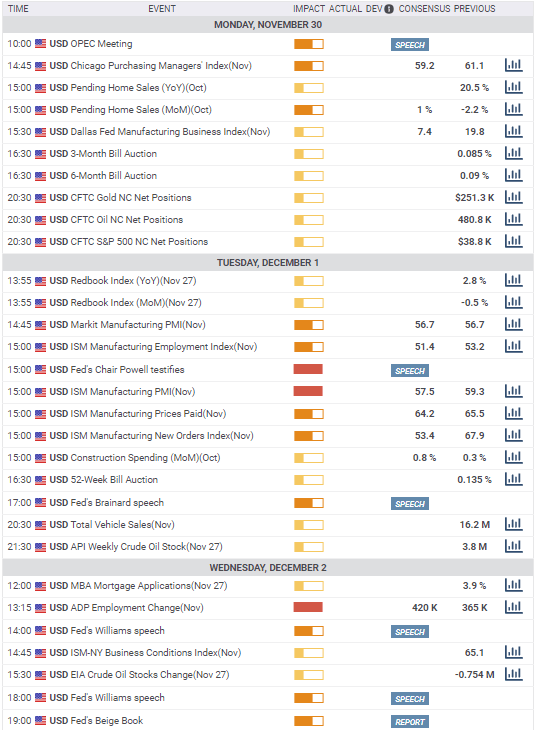
The Employment Situation Report from the Labor Department for November leads the information parade. After the recent reversal in Jobless Claims markets will be looking for reassurance that the employment recovery is on track. Weakness in Nonfarm Payrolls could damage equity markets and the dollar. The better than expected PMI reading for November from Markit will need confirmation from the Institute for Supply Management (ISM) before the business improvement is accepted.
The ISM Manufacturing PMI is forecast to drop to 57.8 in November from 59.3. The New Orders Index is expected to fall to 53.4 from 67.9. This forward looking index has beaten estimates for five straight months. In October it was forecast to drop to 45.9 from 60.2, it rose to 67.9. The Employment Index is predicted to slip to 51.4 from 53.2 in October.
Federal Reserve Chairman Jerome Powell will testify before the US Senate Committee on Banking, Housing, and Urban Affairs as required by the Coronavirus Aid, Relief, and Economic Security Act (CARES).
Construction Spending is forecast to rise 0.8% in October after a 0.3% increase in September.
Private Payrolls from ADP are projected to rise 500,000 in November following 365,000 in September. The Fed’s Beige Book of anecdotal economic assessments for the December 4-5 FOMC meeting is out on Wednesday.
Initial Jobless Claims for the week of November 27 are forecast to slip to 770,000 from 778,000 previously. Continuing Claims are forecast to drop to 5.915 million in the November 21 week from 6.071 million previous. The ISM Services PMI is forecast to dip to 56.4 in November from 56.6. The New Orders Index was 58.8 in October and the Employment Index 50.1.
Nonfarm Payrolls are forecast to add 520,000 in November after 638,000 in October. The unemployment rate (U-3) is expected to be 6.8% in November after 6.9% in October. Average Hourly Earnings should be unchanged on the month in November at 0.1% and 4.6% from 4.5% on the year. The Underemployment Rate (U-6) was 12.1% in October and the Labor Force Participation Rate was 61.7%. Average Weekly Hours will be unchanged at 34.8. Factory Orders are forecast to rise 1% in October, they increased 1.1% in September. The negative Trade Balance is expected to expand to $-65.2 billion in October from $-63.9 billion.
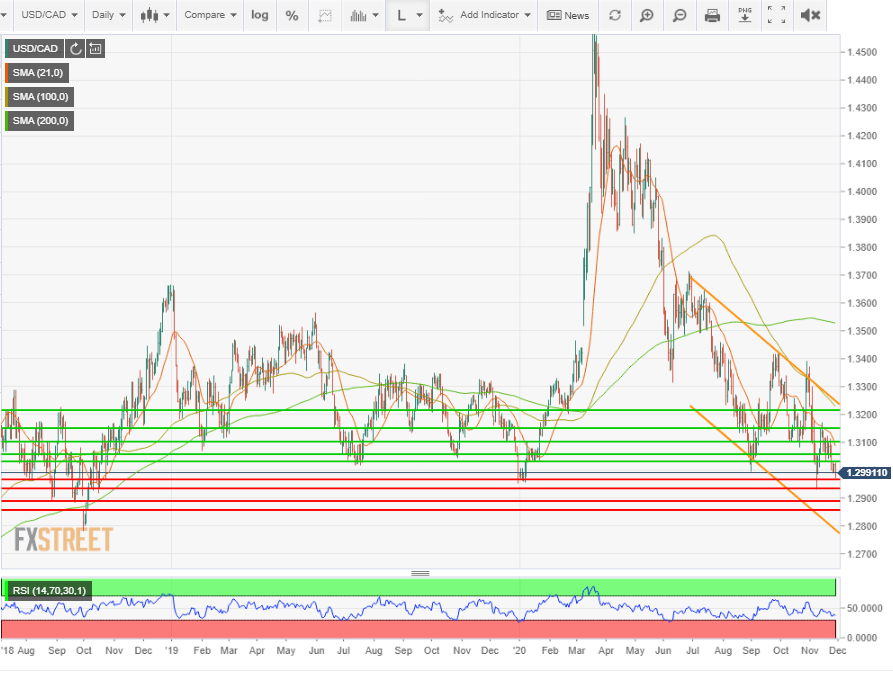
 USD/CAD technical outlook
The Relative Strength Index has been below 50 since November 13 though it has not reached oversold status since early September. Closing the week at 37.14 it suggests further losses. The declines of the last two week have left the moving averages trailing the market by substantial margins. The 21-day line at 1.3087 fronts resistance at 1.3100, the 100-day at 1,3289 and the 200-day at 1.3528 await the USD/CAD’s change of fortune.
The descending channel is of less import as current levels are far from the upper and lower borders. Of more importance is the relative weakness of support wth the first line at 1.2965 the result of a few days trading in early January, the next from a brief drop on November 9 and the rest dating from trading levels more than two years old. Resistance lines in contrast are recent, numerous and well-traded.
Resistance: 1.3020; 1.3065; 1.3100; 1.3150; 1.3215
Support: 1.2965; 1.2930; 1.2890; 1.2855
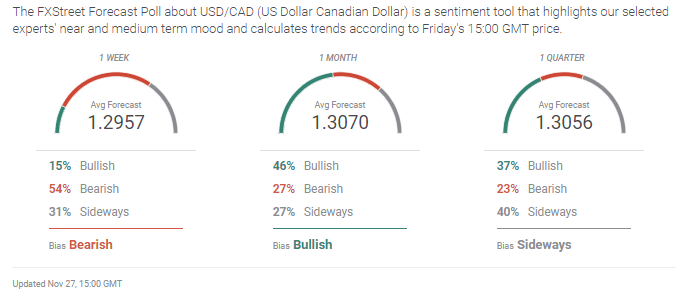
 USD/CAD Forecast Poll
The weakness of the USD/CAD decline is evident in the FXStreet Forecast Poll. The one-week forecast is heavily bearish but the destination at 1.2957 makes no penetration of support. The one-month and one-quarter views move back above support at 1.3000, poised, perhaps for a change in fundamental status.