Volatile August price action here we come, traders focussed on USD resurgence
![]()
Here is what you need to know as we start a new week and month where seasonality comes into play in what is traditionally a volatile month for the forex market:
The week and month ended as we are likely to continue with volatility in the FX space induced by a big bounce in the US dollar vs the yen.
Japan’s finance ministry was warning about the yen’s “rapid” rise. Consequently, USD/JPY’s low averted 104.19 key supports and it rose back to the May-June low by 106 that it broke below a week ago.
The rebound in the pair played a significant role in the dollar’s broader demand across FX.
The move essentially stripped back all of the hard work done the previous Friday below 106 USD/JPY which had helped fuel last week’s sell-off in the greenback.
Friday’s forex price action and main stories
Meanwhile, it was a day of dollar short covering across the G10s.
EUR/USD had set a 26 month high before seller’s emerged in early European trade which had taken the pair down to 1.1850 from Asia’s 1.1909 highs. New York continued to sell and the pair made a low of 1.1762. As mentioned, the yen was a driver in forex so had it not been for gains in the cross, the major would likely have been looking deeper down into the abyss. EUR/JPY bids buoyed the single unit, with a test of 125.20 before easing back below the figure to 124.75 towards the close.
Yen jawboning will likely leave the dollar in a peddle stool in risk-off conditions which leaves the bears vulnerable of further upside in USD/JPY in what is seasonally a poor month for risk appetite. The June and May lows were tested on Friday and could come under renewed pressure following potential and an initial fades if 105.20/50s support structure holds.
GBP/USD fell short of the March highs near the 1.32 level in what has been a phenomenal month for cable bulls, in what can only be described as the law of inertia influencing the price rallying from the mid 1.2250s despite the Brexit tail-risks.
AUD, representing the commodity complex, set a 17-month high in early Europe at 0.7227. The pair was, however, dropping back to a low of 0.7133 for the day in NY, holding at prior resistance and support structure where it will face the bears again at the start of the week where we now await the Reserve Bank of Australia. Similar to the euro, had it not been for intense yen selling, supporting AUD/JPY, lower levels might have been expected to challenge the bull’s commitments at such a critical level as the 0.7060s are in the daily chart.
More to come in the Chart of the Day…
For the day ahead, July PMI data will set the tone on Monday and we will have Chinese Caixin Manufacturing PMI in Asia to start with. This data will follow China’s July manufacturing PMI which last week surprisingly increased to 51.1 from 50.9 in June, its highest since Mar 20.
DXY come back probability just increased
The steep decline in the DXY for July, a 4.4% loss, was its worst monthly percentage drop in a decade.
Here is some background to the dollar’s recent decline:
It is August, a month where the majority of the world usually goes on holiday.
This month has been the worst month for global equities, which would suggest, the dollar should thrive.
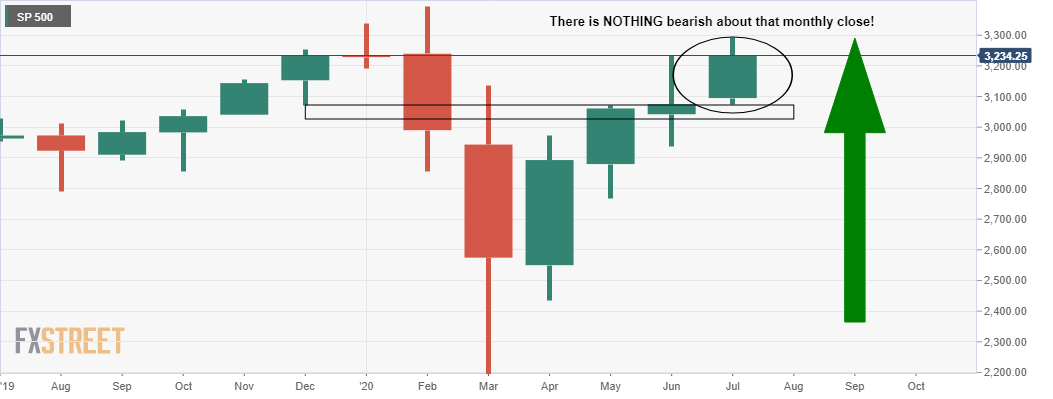
However, there is nothing at all bearish looking on the charts of US stocks following last week’s super busy week which included the Federal Reserve, Congressional testimonies, outstanding earnings from some of the markets biggest names and multi-trillion companies such as Amazon, Apple and Facebook.
The S&P 500 index ended in a highly bullish position and chart formation:
However, all said and done, the US dollar has emerged as the most oversold currency on the board.
In fact, it is the most oversold since March’s panic plunge in daily RSIs and its most oversold on weekly RSIs since January 2018’s low, which was the lowest since 2011.
When we look to positioning, the IMM net spec positioning has been revealing the heaviest net spec dollar short versus the G10 currencies since 2018’s all-time short extremes.
As we head into this week, the stars are aligning for a rebound to snap series of consecutive days of lower highs and lows.
DXY weekly chart: 38.2% upside target
-637319897484541421.png)
The below chart shows the daily stick reaching a resistance structure, so some downside corrective action can be expected still.
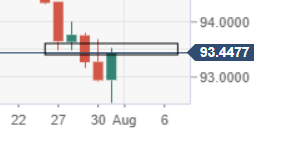
Going down to the 4HR time frame, we can see that a 38.2% Fib retracement of the closing price action for last week would have confluence with prior support and resistance.
-637319906518836470.png)