USD/JPY Price Analysis: Under pressure after failed breakout
![]()
- Down 0.13% on the day, USD/JPY eyes support at 103.52.
- The hourly chart shows a failed breakout, a bearish pattern.
USD/JPY looks south, with the hourly chart showing a failed breakout.
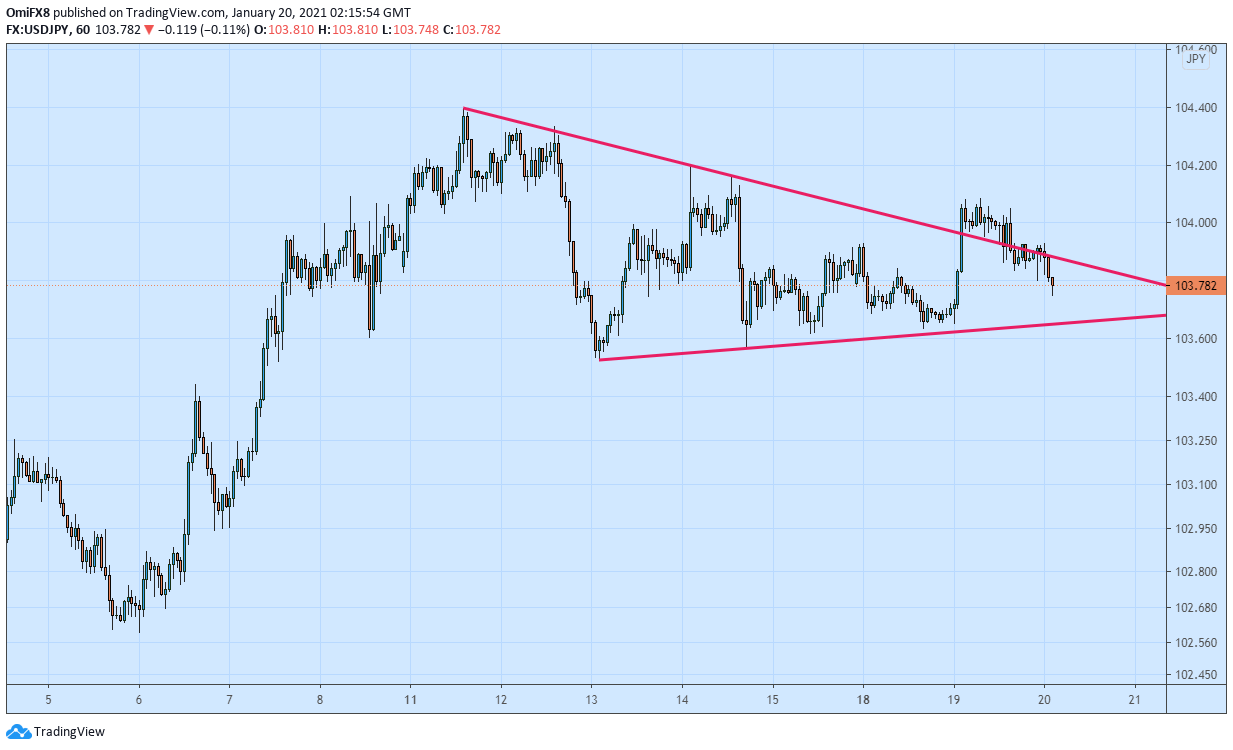
The pair broke higher from a triangle pattern on Monday, confirming a resumption of the recovery rally from the Jan. 6 low of 102.59. However, that failed to inspire the bulls, and the pair fell back inside the triangle pattern on Tuesday.
The failed breakout, a powerful bearish signal, looks to be attracting selling pressure at press time. The pair is currently trading near 103.77, representing a 0.13% drop on the day and could drop to 103.52 (triangle low). The below-50 reading on the 14-hour Relative Strength Index favors the bearish case.
On the higher side, 104.08 is the level to beat for the bulls. A violation there would revive the bullish outlook and open the doors for 104.40 (Jan. 11 high).
Hourly chart
Trend: Bearish