Gold Price Forecast: XAU/USD attempts a bounce amid falling yields, will it last?
![]()
- Gold price benefits from the sell-off in the US Treasury yields, risk-off mood.
- Flattening of the yield curve amid Fed’s hawkishness keeps USD buoyed.
- Gold’s recovery losing momentum below the falling wedge resistance.
Gold price (XAU/USD) extended its six-day losing streak on Friday and reached the lowest levels in two months at $1761, recording a 6% loss on a weekly basis. Gold bulls faced rejection below the $1800 mark in the first half of the day, resuming the downtrend. The Fed’s hawkish turn smashed gold while lifting the US dollar to two-month highs across the board. Hopes for sooner-than-expected Fed rate hikes dented gold’s appeal, as it considered a non-interest-bearing investment asset. However, weaker US Treasury yields helped gold price stage a modest recovery heading into the weekly closing. Meanwhile, investors digested the conflicting comments from the Fed policymakers.
Minneapolis Fed President Neel Kashkari said he wants to keep the benchmark short-term interest rate near zero at least through the end of 2023. On the other hand, St. Louis Fed President James Bullard said that he sees a Fed lift-off in late 2022 while adding that the central bank has begun discussing tapering asset purchases.
The bearish trend in gold price is seen reversing starting out a fresh week on Monday, as it draws support from the falling Treasury yields across the curve. The Fed’s hawkishness has poured cold water over the reflation trades, negatively impact the global stocks and yields. The benchmark 30-year Treasury yields have fallen below the key 2% level, four-month lows, suggesting flattening of the yield curve and receding reflation bets. However, the US dollar continues to hold higher ground, which could likely limit the recovery in the gold price. Additionally, gold bulls could turn cautious ahead of a slew of speeches lined up from the Fed policymakers. Tuesday’s Fed Chair Jerome Powell’s testimony will be also closely followed.
Gold Price Chart – Technical outlook
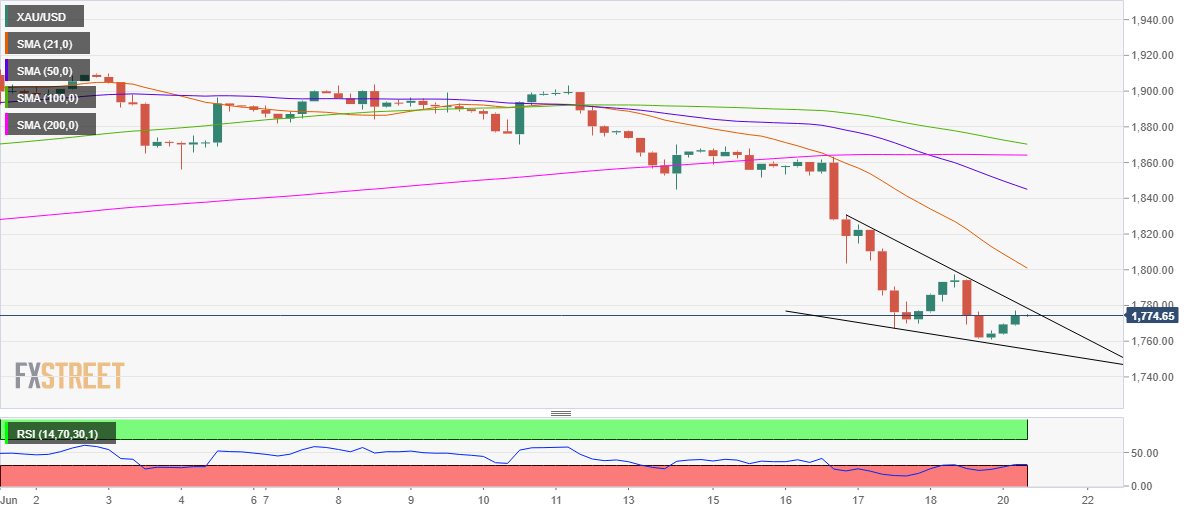
Gold: Four-hour chart
Gold’s four-hour chart shows that the price is pausing its recovery momentum just below the falling trendline resistance at $1778.
Note that gold price is trending within a falling wedge formation on the said time frame, with a break above the latter likely to validate the bullish reversal pattern.
The next target for the bulls will then be seen at the bearish 21-Simple Moving Average (SMA) at $1801.
The further upside will then open up towards the June 17 highs of $1825.
The Relative Strength Index (RSI) has rebounded from the oversold territory, suggesting that there is extra scope for a rebound in prices.
On the flip side, a retest of the monthly lows could be on the cards if gold price faces rejection at the wedge resistance.
Further south, the falling trendline support at $1755 will be the line in the sand for the bullish traders.