GBP/USD Price Analysis: Remains stuck between two key averages, downside favored
- GBP/USD extends range play around 1.3350 amid light trading.
- The cable remains supported as DXY weakness offsets Brexit woes.
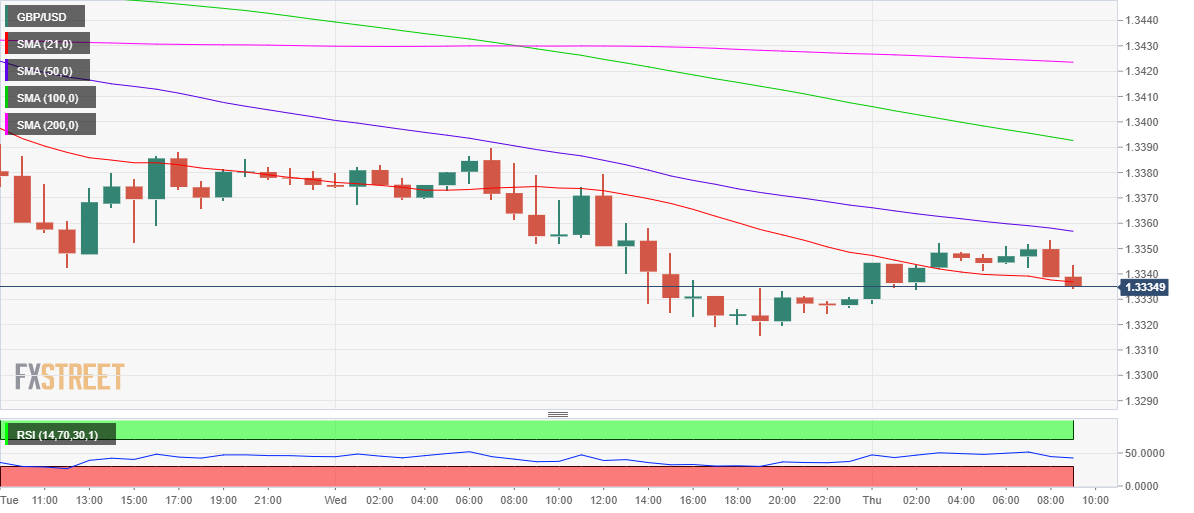
- RSI is sitting just beneath the midline, favoring the downside.
GBP/USD is defending minor bids while wavering around 1.3350 so far this Thursday, as it lacks a trading impetus amid a Thanksgiving Day holiday in the US.
The US dollar remains sluggish across its major peers, correcting some of its previous gains and lending support to the cable. Meanwhile, ongoing Brexit concerns, with France’s pledge to continue its row over fishing rights with the UK, cap the upside attempts in the major.
Markets now look forward to Bank of England (BOE) Governor Andrew Bailey’s appearance scheduled later this Thursday for fresh insights on the central bank’s rate hike outlook.
Looking at GBP/USD’s hourly chart, the bull-bear tug-of-war is seen extending between the bearish 50-Hourly Moving Average (HMA) and the descending 21-HMA, which are placed at 1.3357 and 1.3337 respectively.
A breakout in either direction is needed to trigger some action in the cable, which is trading lackluster since mid-Asia.
However, with the Relative Strength Index (RSI) still holding below the midline, the downside appears more favored.
An hourly closing below the 21-HMA support will fuel a fresh drop towards the 11-month troughs of 1.3316.
Deeper declines could threaten the 1.3300 level.
GBP/USD: Hourly chart
Alternatively, acceptance above 50-HMA is critical to extending the recovery momentum towards 1.3400.
The next significant resistance awaits at the 1.3450 psychological mark.


