EUR/USD Forecast: Bears retake control, King Dollar is back
![]()
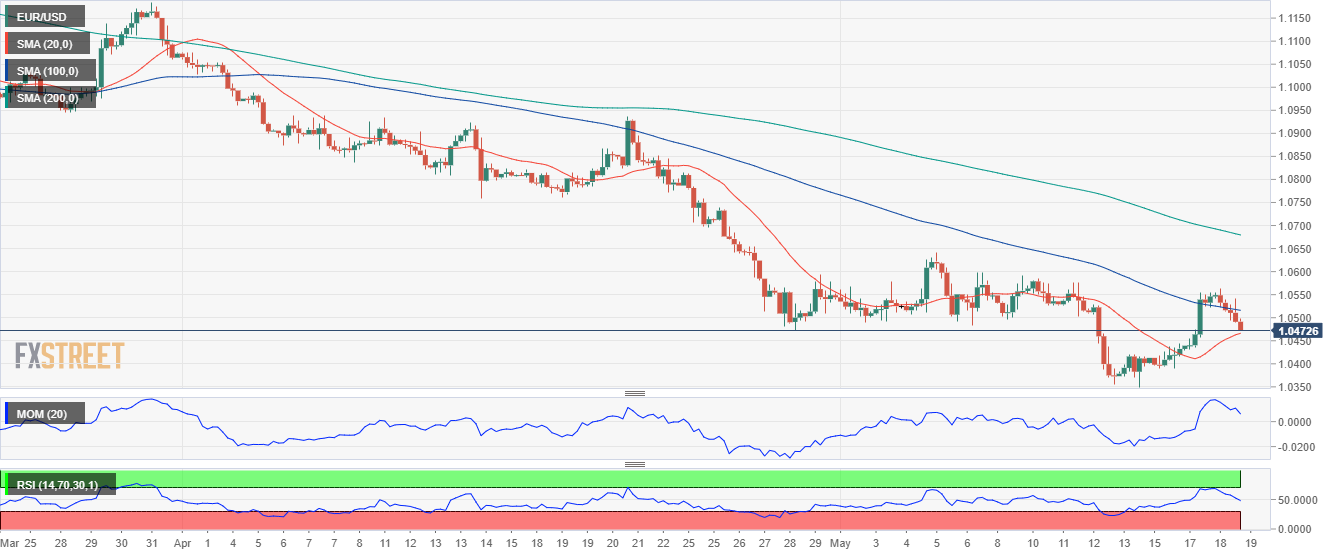
EUR/USD Current Price: 1.0472
- Investors changed course and abandoned high-yielding assets amid global overheating inflation.
- Wall Street plummeted, anticipating several 50 bps rate hikes in the US.
- EUR/USD shed roughly 100 pips, now poised to break below 1.0400.
The EUR/USD pair edged lower on Wednesday, ending the day near a daily low of 1.0475. The pair pulled back from a weekly high of 1.0563 as the market’s mood took a turn for the worse mid-European session following the release of inflation figures. The EU Consumer Price Index growth was confirmed at 7.4% YoY in April, slightly below the preliminary estimate of 7.5%, although the core inflation was upwardly revised to 3.5% from 3%.
But it was not just the EU. The UK reported that the CPI increased by 9% in the year to April, while later it was the turn of Canada, which reported its annual inflation hit 6.8%. Overheating price pressures are a drag on economic growth, already undermined by supply-chain issues and the Eastern European crisis.
Stocks took it negatively, with European indexes closing in the red and Wall Street nose-diving. The Dow Jones Industrial Average shed over 1,000 points intraday amid resurgent demand for safety. The greenback made the most out of it, strengthening against most major rivals.
As for the US, the country published April Building Permits, down 3.2% MoM, and Housing Starts for the same month, which declined by 0.2%, both missing the market’s expectations and further exacerbating the dismal mood.
On Thursday, the European Central Bank will release the minutes of its latest meeting, while the EU will publish the March Current Account and Construction Output for the same month. The US will release April’s Existing Home Sales.
EUR/USD short-term technical outlook
The EUR/USD pair seems to have completed its bullish correction and is on its way to resuming its decline. The daily chart shows that the pair retreated after testing a firmly bearish 20 SMA, while technical indicators have lost their bullish strength. The Momentum is currently consolidating around its midline, while the RSI has already resumed its decline, now at 39.
The 4-hour chart shows that the pair fell after repeatedly failing to overcome a bearish 100 SMA and is now around a mildly-bullish 20 SMA. Technical indicators have retreated from overbought levels, with the Momentum flat at around 100 and the RSI heading south at around 48, hinting at a bearish continuation in the upcoming sessions.
Support levels: 1.0470 1.0430 1.0390
Resistance levels: 1.0520 1.0575 1.0620
View Live Chart for the EUR/USD