Cardano Price Prediction: ADA defends critical support level and reignites run to $2
![]()
- Cardano price had to defend a critical support point at $0.33 in order to resume its uptrend.
- The digital asset successfully defended it and can resume its massive uptrend to $2.
Cardano had a significant breakout from an inverse head and shoulders pattern on the weekly chart that had a price target of $2. As we discussed in our previous analysis, Cardano still needs to climb above $0.38 for the bulls to be in full control.
Cardano price rebounds from $0.33 and aims for more
On the daily chart, Cardano price had to defend a crucial support level at $0.33 which also coincides with the 12-EMA. Bulls successfully stopped the price from falling lower and have bought the dip pushing ADA to $0.353 at the time of writing.
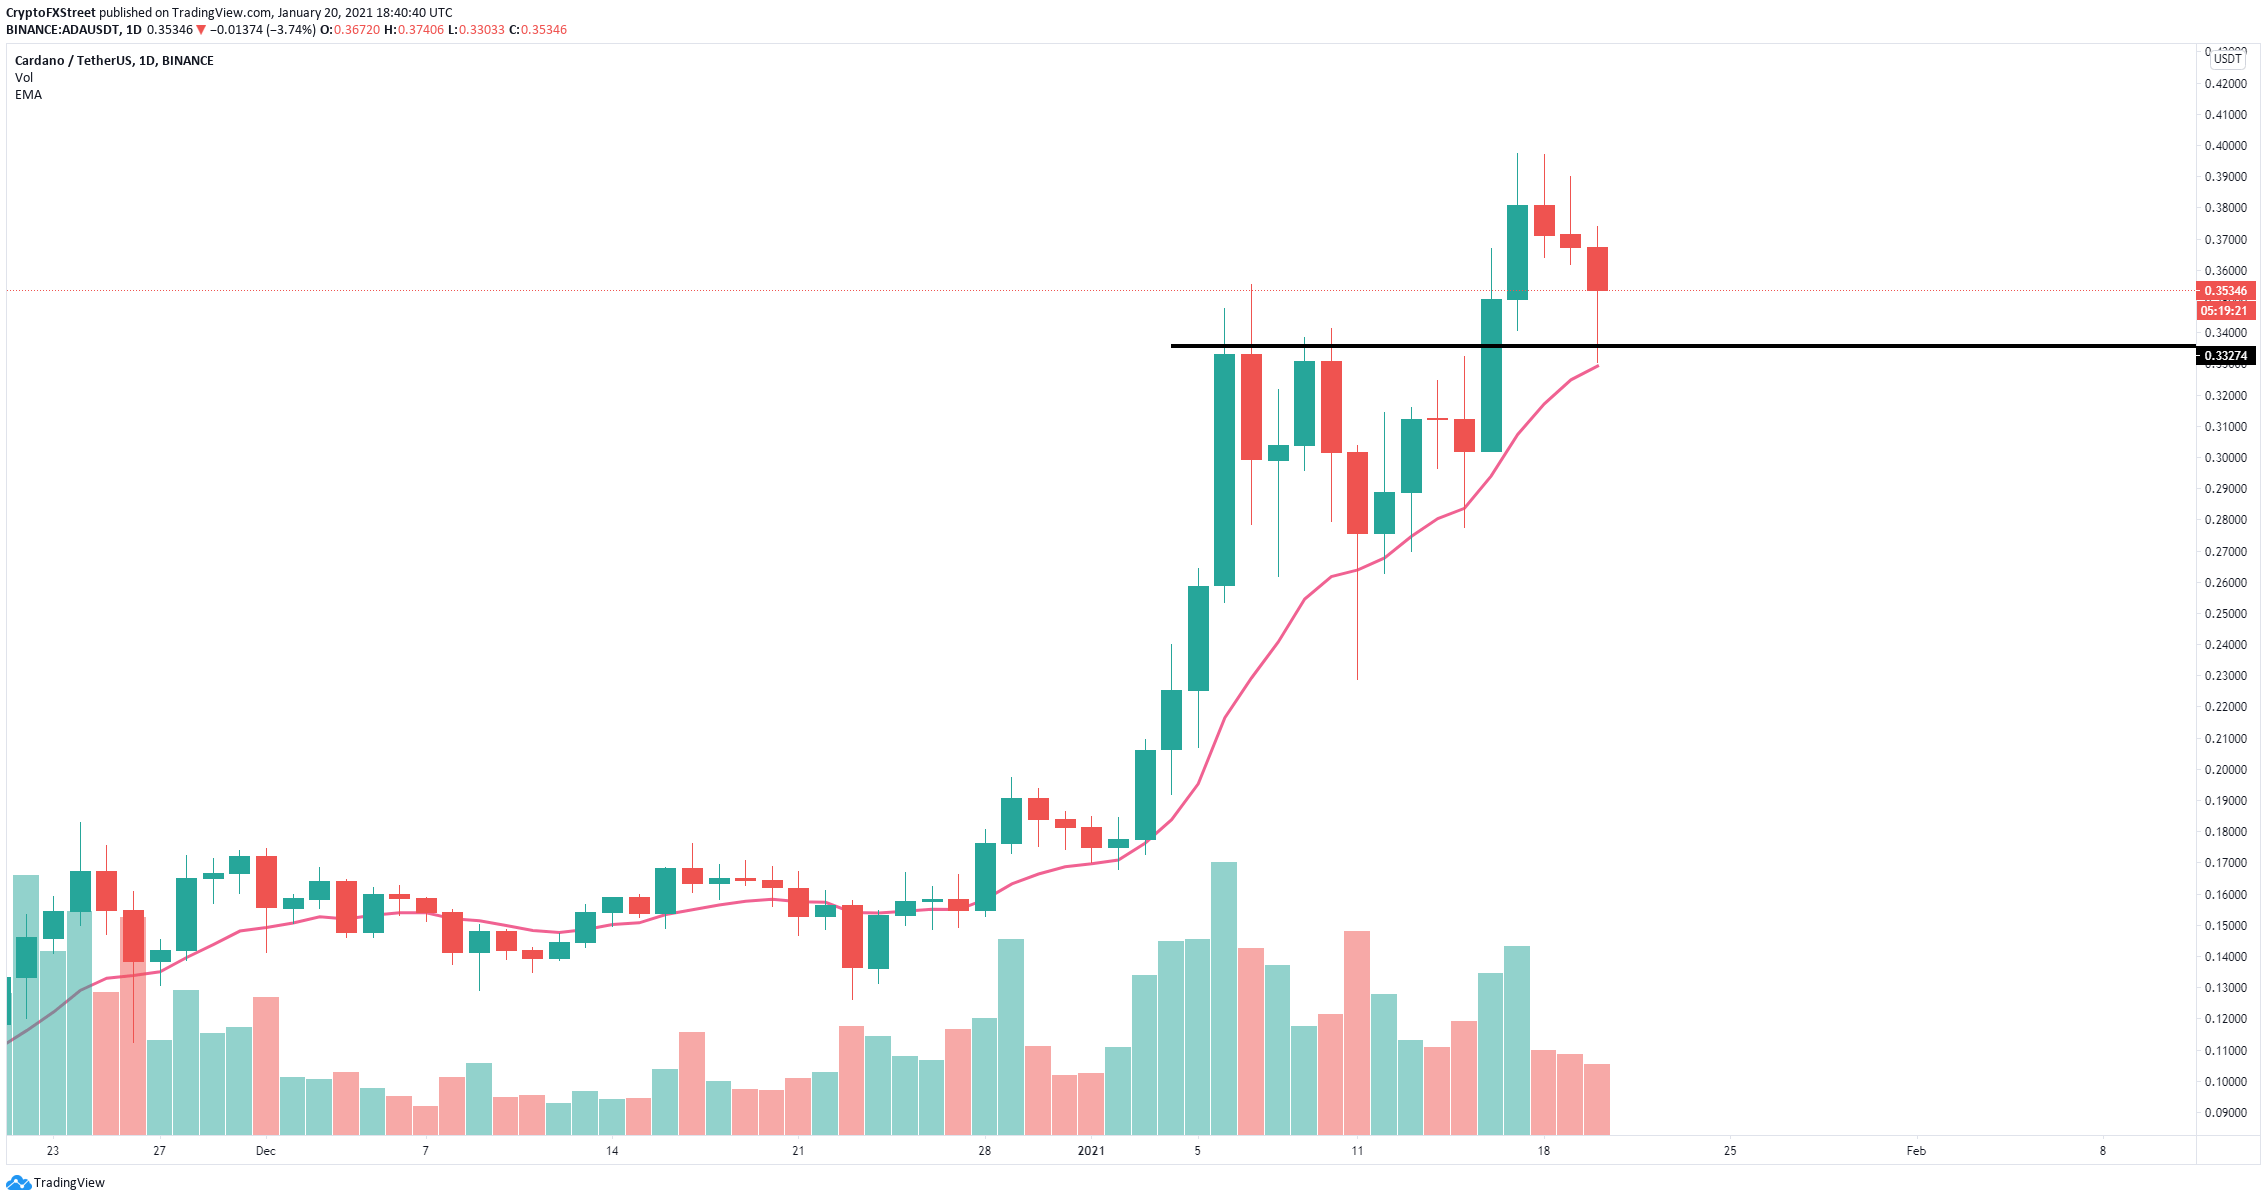
ADA/USD daily chart
According to the In/Out of the Money Around Price (IOMAP) chart still shows the strongest resistance area to be located between $0.37 and $0.38. A breakout above this point would push Cardano to its long-term price target of $2.
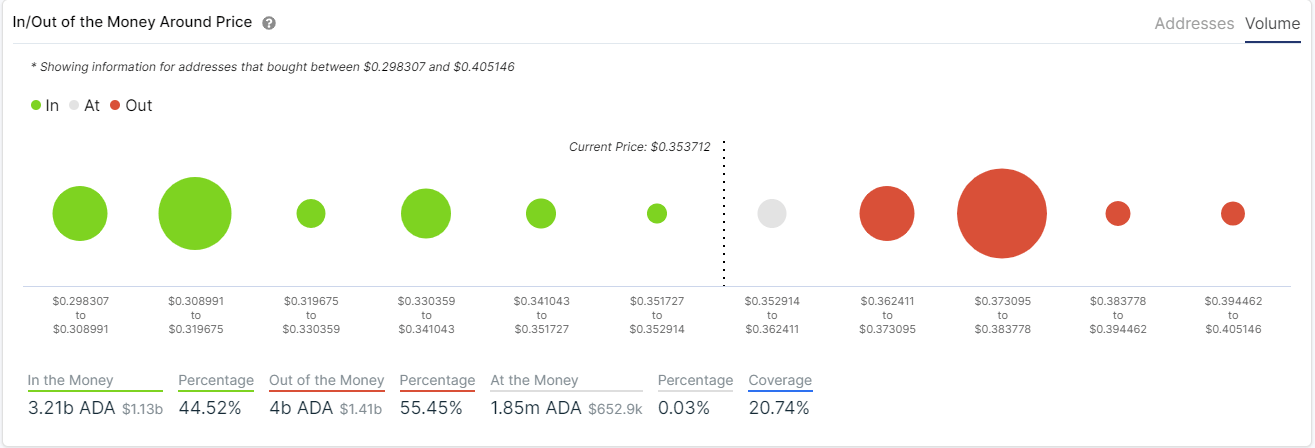
ADA IOMAP chart
However, the IOMAP model also indicates that there is very low support compared to the resistance above. The most significant support area is established between $0.30 and $0.32.