Stellar Price Prediction: XLM on the brink of a 35% move according to key indicator
![]()
- Stellar price has been trading sideways for the past several days.
- The digital asset is primed for a massive move as it is contained inside a tightening pattern.
- Two key levels will determine the short-term future of Stellar.
Stellar has been trading relatively sideways for the past week while volatility dropped significantly. The digital asset is contained inside a symmetrical triangle pattern which is on the verge of bursting.
Stellar price primed for a 35% breakout or breakdown
On the 1-hour chart, a large symmetrical triangle pattern is on the verge of a breakout or breakdown. The two key levels are located at $0.417 for the resistance and $0.39 for the support level.
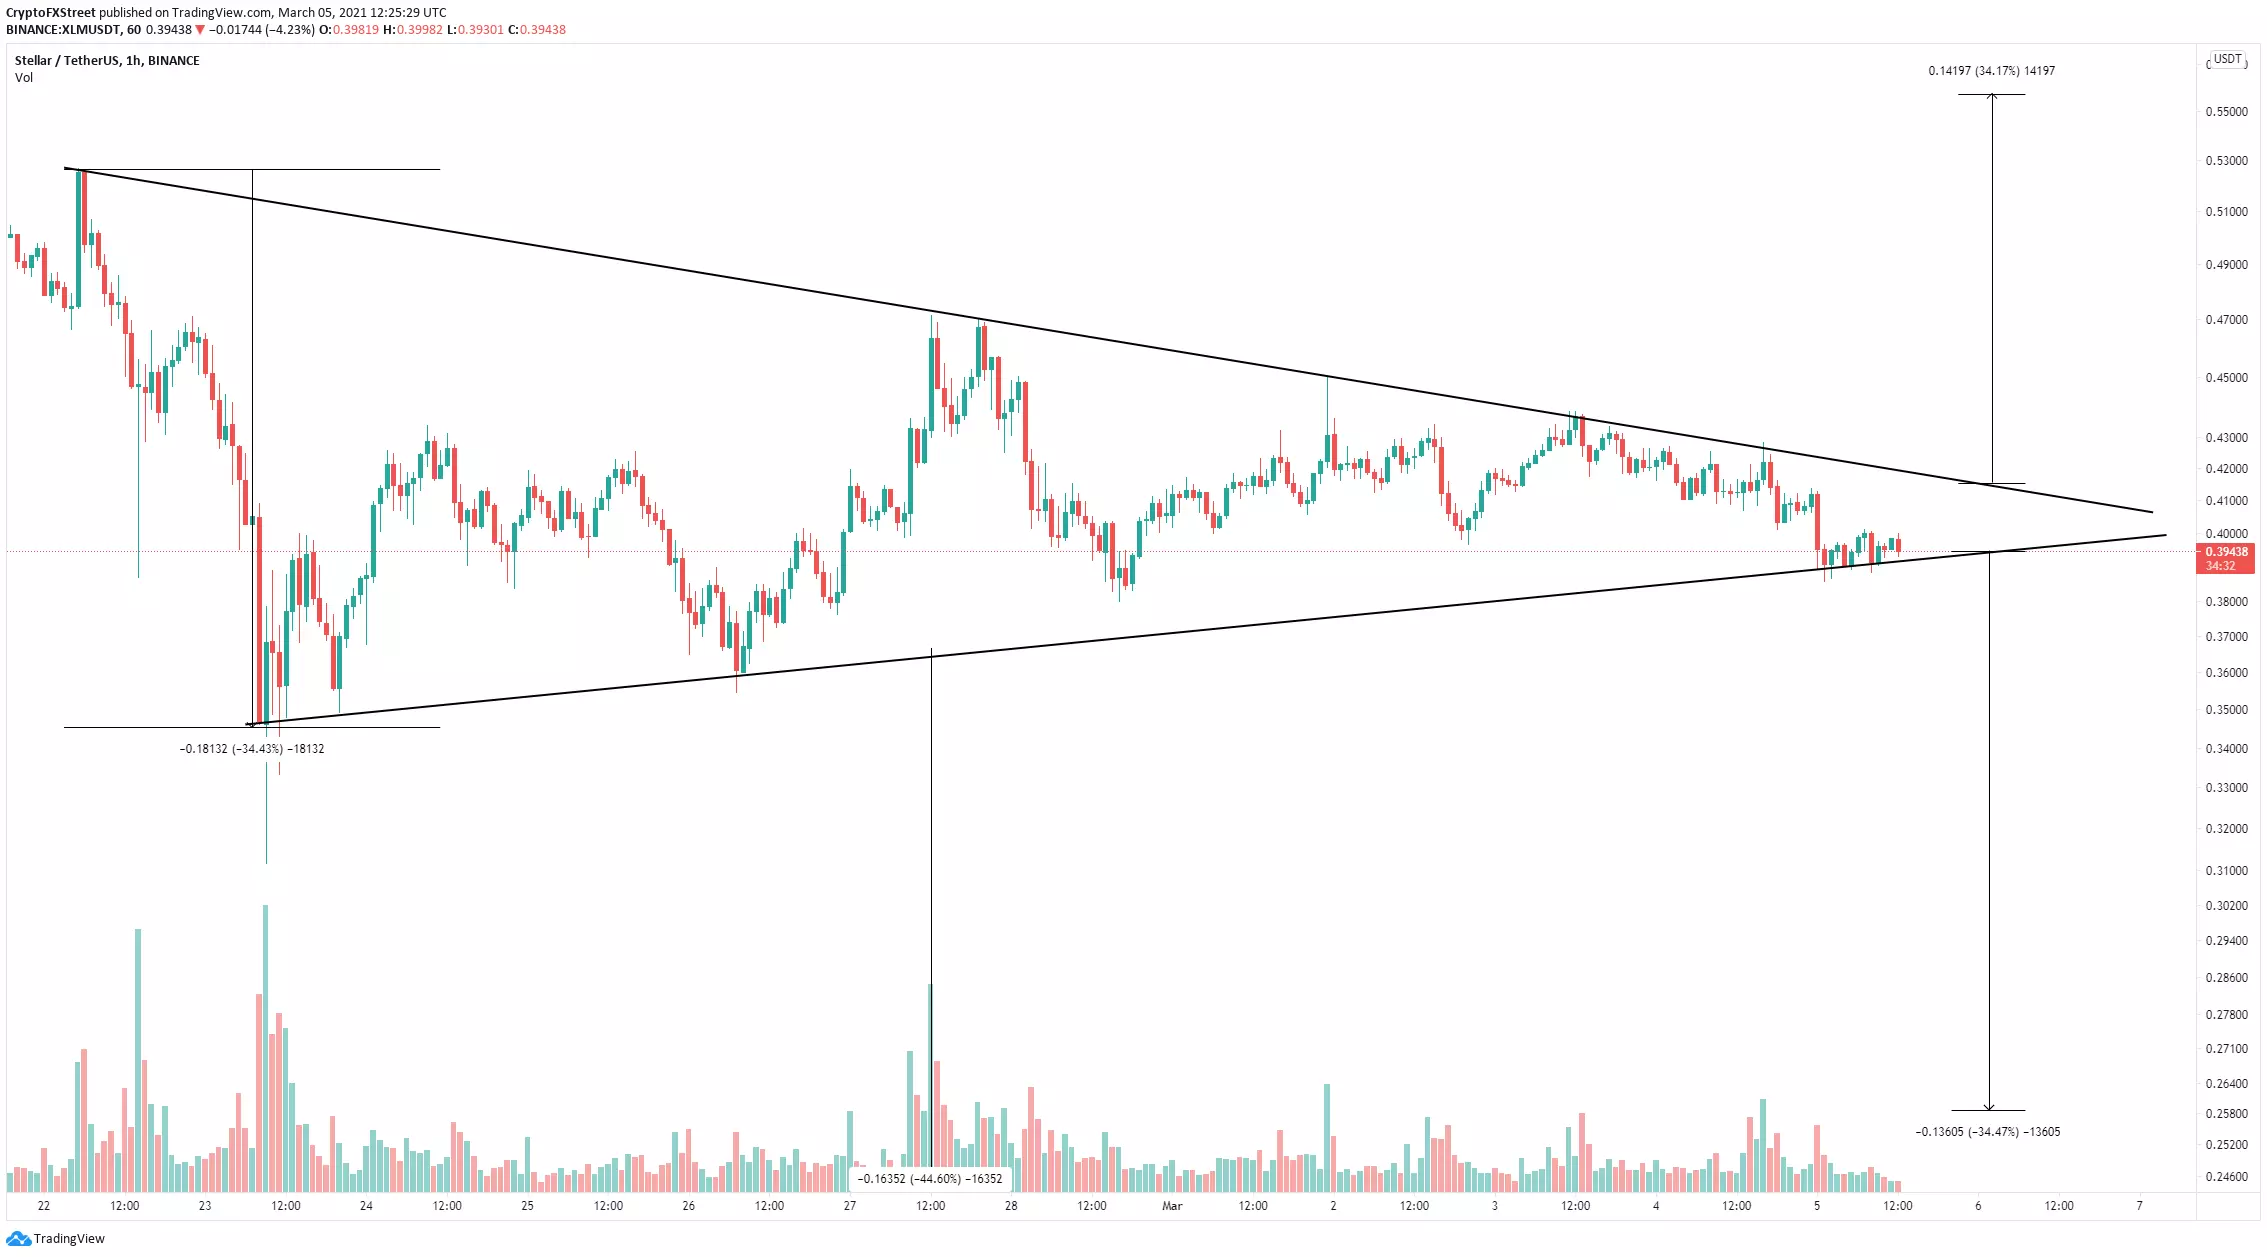
XLM/USD 1-hour chart
A breakout above the key resistance trendline at $0.417 will quickly push Stellar price towards $0.56, a 34% move calculated using the height of the pattern as a reference point. On the other hand, losing the support level of $0.39 will push XLM down to $0.26, which is also a 34% drop.