Bitcoin price is in limbo, but here are the levels to watch
![]()
- Bitcoin price is seeking higher support at $23,500 after aborting recovery above $24,000.
- If bears have their way, the largest cryptocurrency will stretch the down leg to $21,500.
- Bitcoin price will stay within two key levels – $23,206 and $23,870 unless something drastic occurs.
Bitcoin price is slipping below a key governing pattern after the Federal Reserve’s July minutes hinted at less stringent monetary policy in 2023. Live price data from CoinGecko reveals an increase in cumulative weekly losses to 1.8%. Bitcoin price is expected to make a quick rebound above $23,500, but investors cannot rule out potential declines to $21,500 and $18,000, respectively.
Investor sentiment flips negative as Bitcoin price breaks below key trend line
The United States Federal Reserve’s July minutes have intimated the possibility of a looser monetary policy in 2023. On Thursday, investors expressed their concerns on different social media platforms amid fears of heightened volatility.
The Fed is expected to continue elevating the rates for the rest of 2022 – creating a liquidity squeeze. However, potential interest rate cuts in the subsequent year are unlikely to have an immediate positive impact.
“The liquidity contraction is still underway. The Fed’s remarks in the minutes of its July meeting indicated that the liquidity contraction may end in 2023. Still, the timing of the re-addition of liquidity is unknown,” reckoned Griffin Ardern, a trader with Blofin, a crypto asset management company.
For now, all attention is on Bitcoin price, particularly if it succumbs to the rising selling pressure. The formation of a falling wedge pattern on the daily chart infers its downtrend is far from over. Therefore, if BTC does not reclaim the inflection point at $24,000, investors should acclimatize to a 10.65% dip to $21,500.
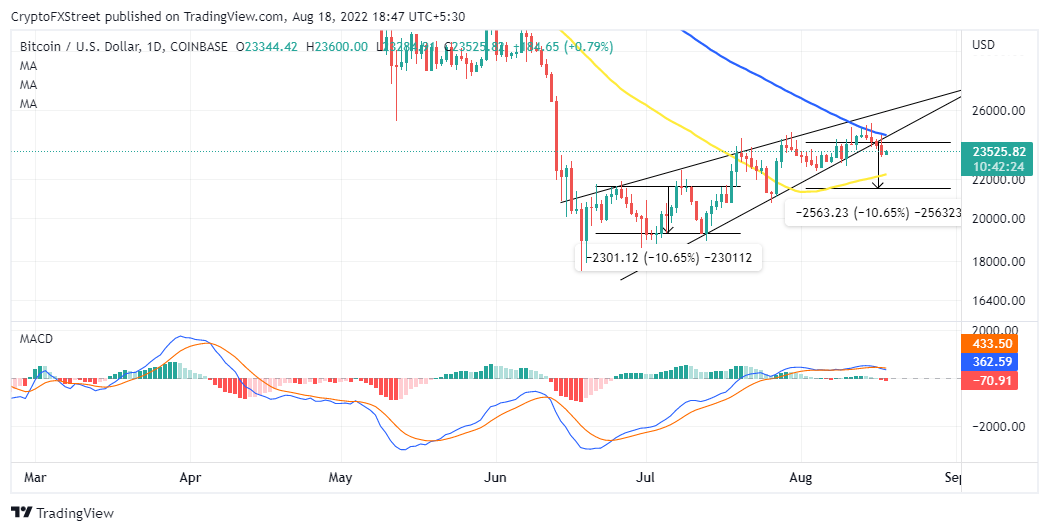
BTC/USD daily chart
Adding credence to the bearish outlook is the Moving Average Convergence Divergence (MACD) indicator on the same daily chart. As the 12-day Exponential Moving Average (EMA) widens the divergence below the 26-day EMA, confidence builds among sellers desiring to short Bitcoin price to $21,500 (a conservative target) or the buyer congestion at $18,000 – further downstream.
Fundamentally, Bitcoin price is unable to extend movement on either side of $23,206 and $23,870. The upper limit ($23,870) represents around 1.03 million addresses that bought roughly 624 BTC in the area. It would be a daunting challenge for Bitcoin price to navigate this region because these investors are likely to sell at their respective breakeven points – dampening its bullish momentum.
-637964288148099534.png)
Bitcoin IOMAP chart
The lower range limit at $23,206 highlights around 877,000 addresses that previously purchased approximately 562 BTC in the region. If these buyers stand their ground, Bitcoin price will not explore downhill levels to $21,500 or $18,000. Therefore, Bitcoin price might stay in limbo much longer than expected.