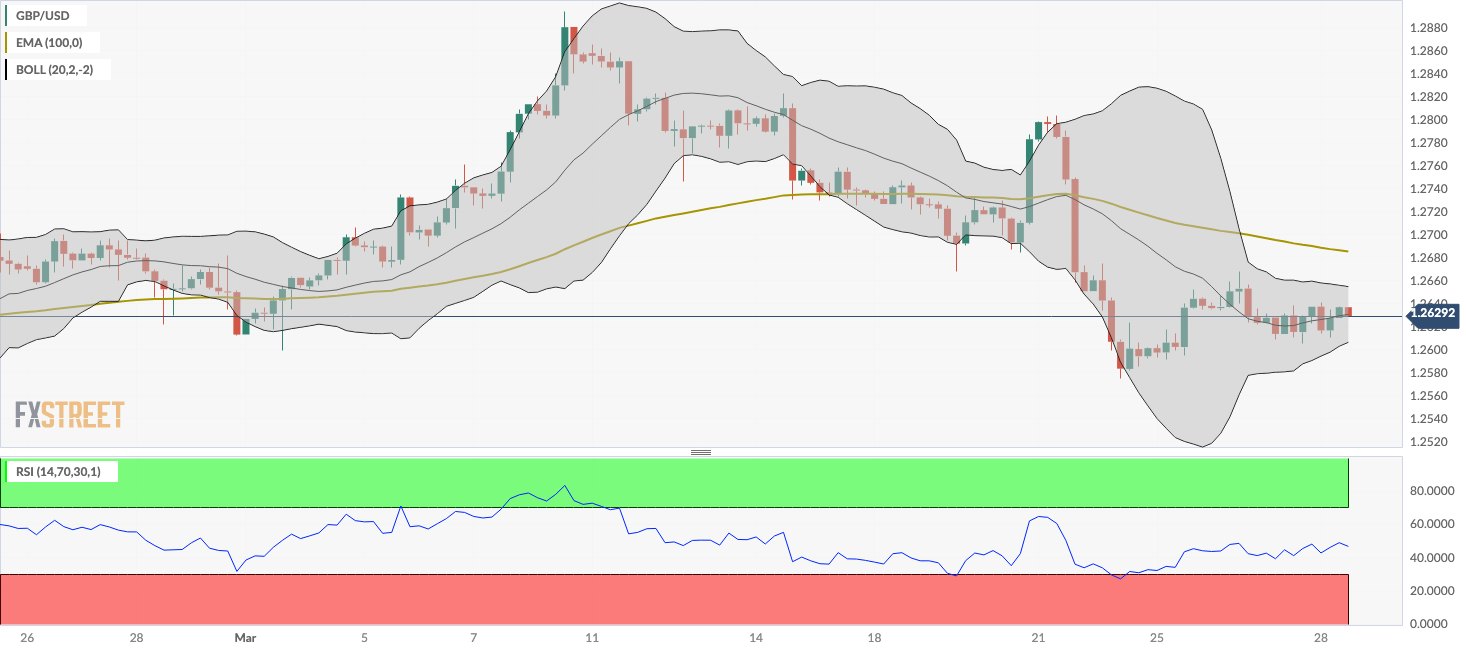
GBP/USD Price Analysis: The next downside target is located at the 1.2600–1.2605 region
- GBP/USD trades on a softer note below the mid-1.2600s on Thursday ahead of UK GDP growth numbers data.
- The pair keeps the bearish vibe below the key EMA; RSI indicator holds below the 50 midlines.
- The immediate resistance level will emerge at 1.2655; the initial support level is located at the 1.2600–1.2605 zone.
The GBP/USD pair remains on the defensive around 1.2630 on Thursday during the early European trading hours. The hawkish tone from Federal Reserve (Fed) Governor Christopher Waller early Thursday has lifted the US Dollar (USD) broadly, which creates a headwind for the GBP/USD pair.
The Fed’s Waller said the US central bank is in no rush to cut the benchmark rate and may need to “maintain the current rate target for longer than expected. Traders await the final UK Gross Domestic Product (GDP) growth number for Q4 on Thursday, which is projected to contract 0.3% QoQ in Q4.
From a technical perspective, GBP/USD maintains the bearish outlook unchanged as the major pair holds below the key 100-period Exponential Moving Average (EMA) on the four-hour chart. The downward momentum is confirmed by the Relative Strength Index (RSI), which lies below the 50 midlines, supporting the sellers for the time being.
The first upside barrier for GBP/USD will emerge near the upper boundary of the Bollinger Band at 1.2655. A break above the latter will expose the 100-period EMA at 1.2685. Further north, the next hurdle is seen near a high of March 18 at 1.2746, followed by the psychological level of 1.2800.
On the flip side, the initial support level of the major pair is located near the lower limit of the Bollinger Band at the 1.2600-1.2605 region. A breach of this level will pave the way to a low of March 22 at 1.2575. The next contention level to watch is a low of February 14 at 1.2535, en route to the 1.2500 round figure.


