AUD/USD Forecast: Bears hold the grip, 0.6400 at sight
![]()
AUD/USD Current Price: 0.6518
- Most markets will be closed on Friday amid the Easter Holiday.
- Australian Consumer Inflation Expectations remain well above the RBA’s inflation goal.
- AUD/USD briefly traded below the 0.6500 mark, may resume its decline in the near term.
The AUD/USD pair traded as low as 0.6484 on Thursday, but it trimmed most of its intraday losses and heads into the daily close trading around 0.6520. The US Dollar turned firmly higher mid-European session, as market players assessed comments from US Federal Reserve (Fed) official Chris Waller indicating that he is not in a rush to trim interest rates.
Earlier in the day, the Aussie took a hit from local data. March Consumer Inflation Expectations stood at 4.3%, easing from the previous 4.5% but still far above the Reserve Bank Australia goal of 2% to 3%. Additionally, Retail Sales posted a modest 0.3% advance in February, missing the expected 0.4% and down from 1.1% in January.
Near-term government yields surged amid uncertainty about when and by how much the Federal Reserve (Fed) will finally trim interest rates. Investors may get some clues from United States (US) data on Friday, as the country will publish the core Personal Consumption Expenditures (PCE) Price Index, the central bank’s favorite inflation gauge. It is worth adding that most markets will be closed on Friday amid the celebration of Easter Holidays. In the Asian session, only Japanese markets will be opened normally, although market activity is expected to remain reduced until next week.
AUD/USD short-term technical outlook
The AUD/USD pair is closing with modest losses for a third consecutive day, although lower lows favor a downward extension in the coming days. The daily chart shows the pair hovers just below the 61.8% Fibonacci retracement of the 0.6441/0.6666 rally at 0.6527, the immediate resistance level. The same chart shows AUD/USD develops below all its moving averages, although they lack apparent directional strength. Finally, technical indicators grind lower within negative levels, skewing the risk to the downside but lacking momentum.
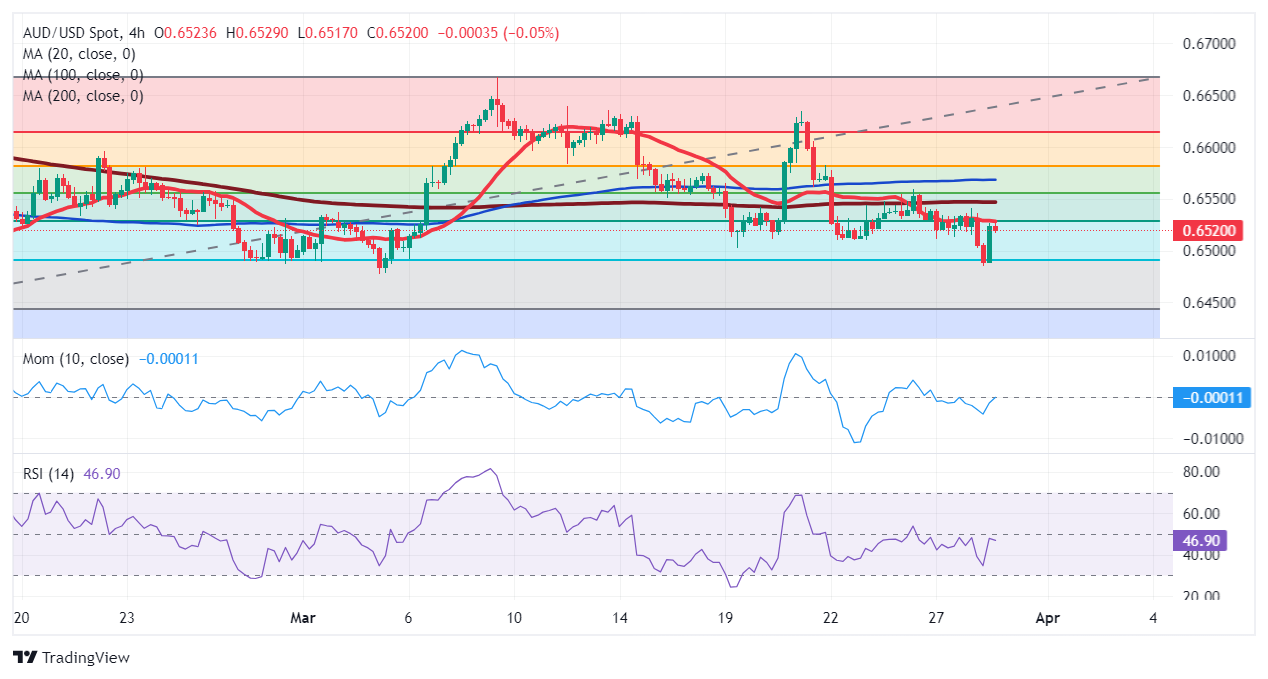
The near-term picture also favors a bearish extension. In the 4-hour chart, a mildly bearish 20 Simple Moving Average (SMA) converges with the aforementioned Fibonacci resistance level, reinforcing it. The longer moving averages remain directionless above the 20 SMA, while technical indicators pared their upward corrections within negative levels and resumed their slides. Renewed selling pressure below 0.6500 should lead to a slide towards the 0.6430/40 price zone.
Support levels: 0.6500 0.6470 0.6430
Resistance levels: 0.6530 0.6565 0.6600