Australian Dollar moves back and forth amid risk-off mood, stronger US Dollar
![]()
- Australian Dollar loses ground on risk aversion as traders await Israel’s response to Iran’s attack.
- Australian currency faces challenges due to differing monetary policy outlooks between the RBA and the Fed.
- US Dollar received support as stronger-than-expected US Retail Sales figures diminished sentiment regarding early Fed rate cuts.
The Australian Dollar (AUD) extends losses for the third consecutive session on Tuesday, possibly due to the risk aversion as investors cautiously await Israel’s response to Iran’s unprecedented air assault on Saturday. However, the AUD/USD pair pares losses after mixed data from China.
The Australian Dollar faces hurdles amid concerns that the Reserve Bank of Australia (RBA) might need to lower interest rates ahead of the United States (US). According to the Financial Review, the ongoing high inflation in the world’s largest economy raises uncertainty about whether the Federal Reserve can take action this year. Traditionally, as the world’s most influential central bank due to the scale of the financial markets it oversees, the Fed typically leads global rate-cutting cycles.
The US Dollar Index (DXY) remains on an upward trajectory, likely influenced by the rise in US Treasury yields. The stronger-than-anticipated US Retail Sales data has added to the diminishing sentiment regarding the Federal Reserve’s (Fed) potential monetary policy easing, thereby bolstering the US Dollar (USD). Investors are likely to monitor the US housing data slated for release on Tuesday, alongside Fed Chair Jerome Powell’s speech at the Washington Forum.
Daily Digest Market Movers: Australian Dollar depreciates on risk aversion
- Australian labor market data is due on Thursday, including seasonally adjusted Employment Change and Unemployment Rate for March.
- China’s Gross Domestic Product (GDP) rose by 1.6% QoQ in the first quarter of 2024, against the previous quarter’s increase of 1.0%. GDP year-over-year rose by 5.3%, exceeding the expected 5.0% and 5.2% prior.
- China’s Industrial Production (YoY) increased by 4.5% in March, against the market expectations of 5.4% and 7.0% prior.
- Chinese Retail Sales increased by 3.1% in March, as compared to February’s rise of 5.5%. The market was expecting a 4.5% increase.
- Federal Reserve (Fed) Bank of San Francisco President Mary Daly has emphasized that although there has been significant progress regarding inflation, there is still more to be done. She stressed the necessity of being assured that inflation is heading towards the target before making any decisions.
- According to the CME FedWatch Tool, the likelihood of interest rates remaining unchanged in the June meeting has been increased to 77.5% from the previous week of 48.5%.
- US Retail Sales (MoM) increased by 0.7% in March, exceeding the market expectations of 0.3%. The previous reading was revised to 0.9% from 0.6% in February.
- US Retail Sales Control Group rose by 1.1% against the previous increase of 0.3%.
- US yields on 2-year and 10-year Treasury bonds stand at 4.92% and 4.61%, respectively, at the time of writing.
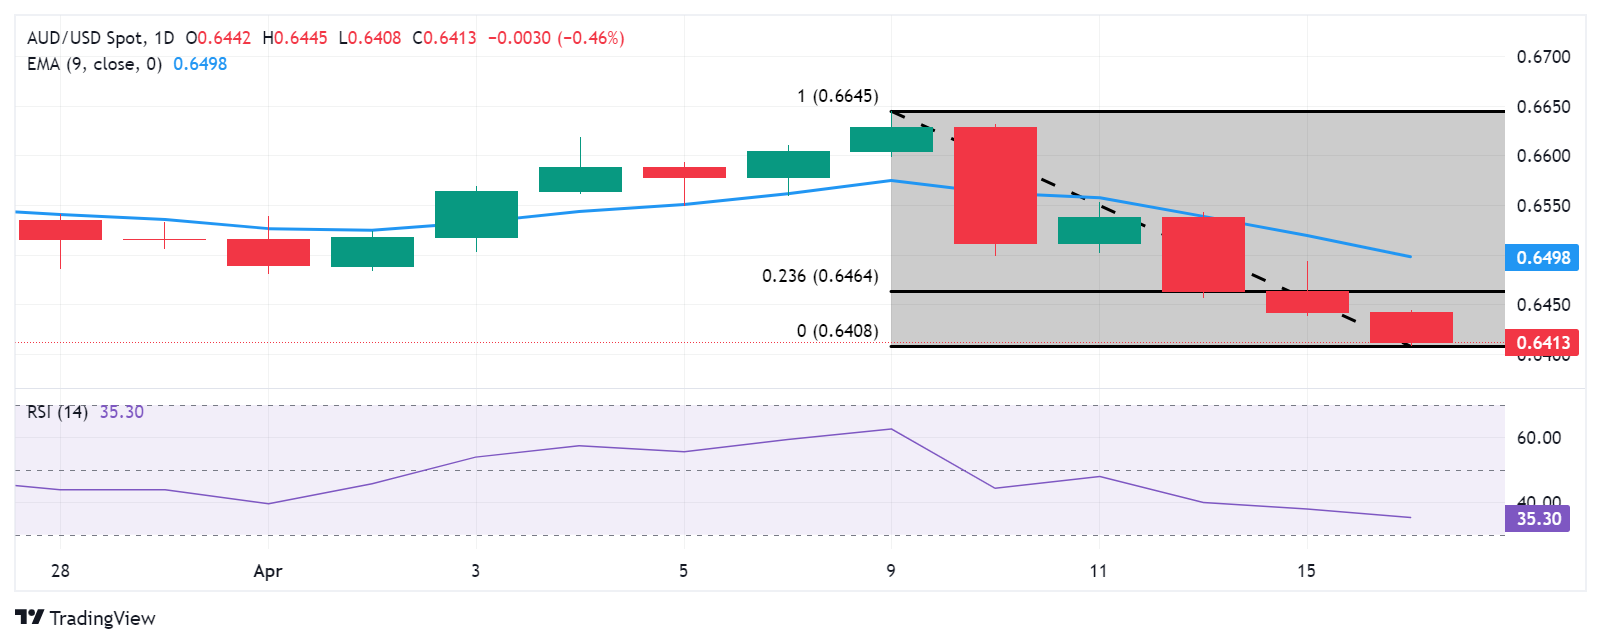
Technical Analysis: Australian Dollar could test the psychological support of 0.6400
The Australian Dollar trades around 0.6420 on Tuesday. The 14-day Relative Strength Index (RSI) suggests a bearish sentiment for the AUD/USD pair as it is positioned below the 50 level. Key support appears at the psychological level of 0.6400. A break below this level could exert downward pressure on the AUD/USD pair to approach the major support at 0.6350, followed by November’s low at 0.6318. On the upside, the AUD/USD pair could find the key resistance at the major level of 0.6450, followed by the 23.6% Fibonacci retracement level of 0.6464. A breakthrough above the latter could support the pair in testing the nine-day Exponential Moving Average (EMA) at 0.6499, which is aligned with the psychological level of 0.6500.
AUD/USD: Daily Chart
Australian Dollar price today
The table below shows the percentage change of Australian Dollar (AUD) against listed major currencies today. Australian Dollar was the weakest against the US Dollar.
| USD | EUR | GBP | CAD | AUD | JPY | NZD | CHF | |
| USD | 0.09% | 0.09% | 0.05% | 0.23% | 0.06% | 0.19% | 0.08% | |
| EUR | -0.09% | -0.01% | -0.06% | 0.14% | -0.02% | 0.11% | -0.03% | |
| GBP | -0.08% | 0.01% | -0.03% | 0.16% | 0.00% | 0.12% | -0.02% | |
| CAD | -0.05% | 0.05% | 0.04% | 0.17% | 0.01% | 0.14% | 0.02% | |
| AUD | -0.21% | -0.13% | -0.16% | -0.19% | -0.14% | -0.01% | -0.15% | |
| JPY | -0.06% | 0.00% | -0.01% | -0.03% | 0.16% | 0.14% | 0.00% | |
| NZD | -0.18% | -0.11% | -0.12% | -0.15% | 0.03% | -0.13% | -0.12% | |
| CHF | -0.08% | 0.01% | 0.01% | -0.02% | 0.17% | 0.01% | 0.13% |
The heat map shows percentage changes of major currencies against each other. The base currency is picked from the left column, while the quote currency is picked from the top row. For example, if you pick the Euro from the left column and move along the horizontal line to the Japanese Yen, the percentage change displayed in the box will represent EUR (base)/JPY (quote).