EUR/USD Forecast: Bears persist, prepare to challenge 1.0600
![]()
EUR/USD Current price: 1.0633
- The Eurozone confirmed annual inflation stood at 2.4% YoY in March.
- Fed officials and ECB President Lagarde’s speeches stand out in the American session.
- EUR/USD trades with modest intraday gains, but sellers hold the grip.
The EUR/USD pair trades within familiar levels on Wednesday as the dismal market mood partially receded. The US Dollar posts modest intraday losses against major rivals as stock markets changed course and hold in the green. On the one hand, it seems that market participants have digested that rate cuts are nowhere near in the United States (US). On the other, persistent tensions in the Middle East maintain financial markets in a cautious mode.
The latest on the matter indicates that negotiations between Israel and Hamas to secure a truce in Gaza and a release of hostages have stalled, according to Qatar’s Prime Minister Mohammed bin Abdulrahman bin Jassim Al Thani. Additionally, Israel is determined to respond to Iran’s weekend attack, with the war cabinet still deciding the best strategy.
Data-wise, the Eurozone confirmed the March Harmonized Index of Consumer Prices (HICP) at 2.4%, as previously estimated, and the core annual reading at 2.9%. The American session will feature speeches from several Federal Reserve (Fed) officials, as well as a speech from the European Central Bank (ECB) President Christine Lagarde.
EUR/USD short-term technical outlook
The daily chart for the EUR/USD pair shows a limited bullish potential. The pair keeps trading far below bearish moving averages, with the 20 Simple Moving Average (SMA) accelerating south below the longer ones. At the same time, technical indicators have bounced modestly from oversold levels but lack enough momentum to anticipate another leg north.
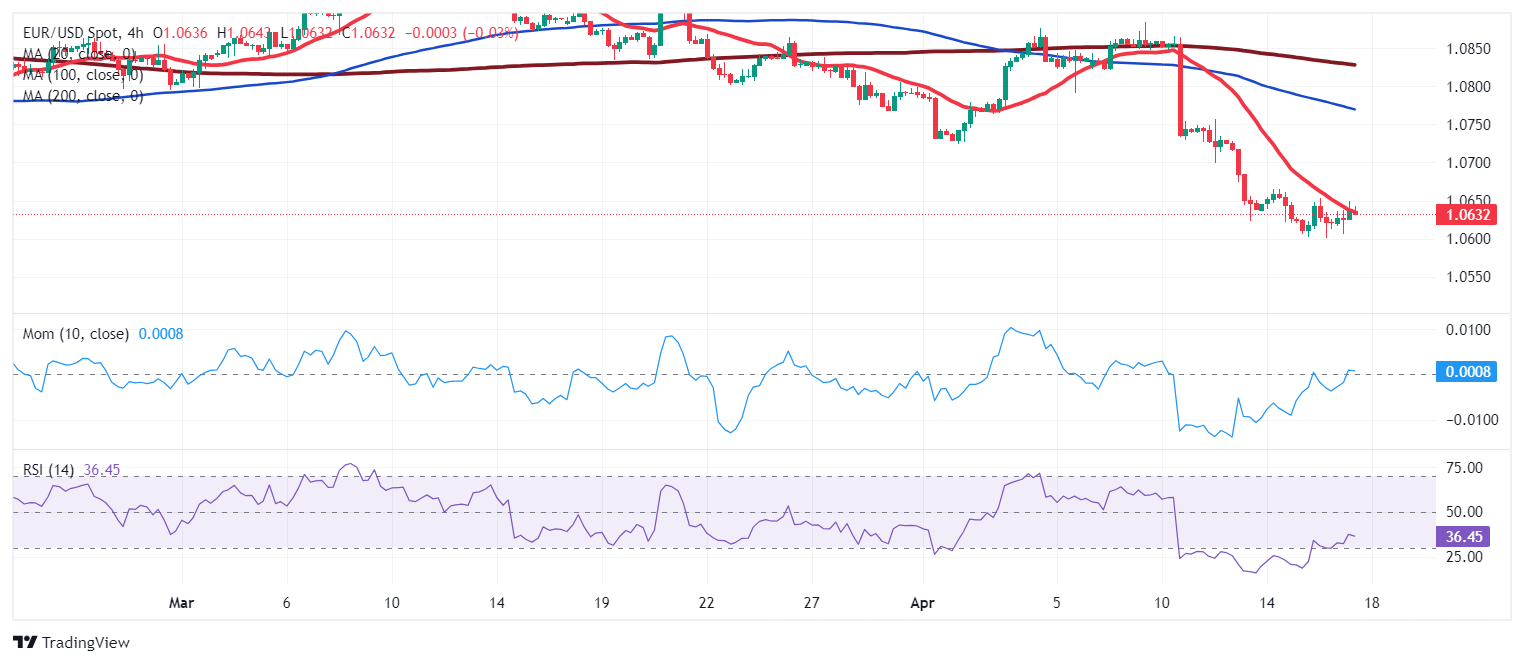
According to the 4-hour chart, bears retain near-term control. EUR/USD briefly traded above a bearish 20 SMA but is back below the indicator. Meanwhile, the 100 and 200 SMAs maintain their bearish slopes well above the shorter one, reflecting persistent selling interest. Finally, technical indicators resumed their slides within negative levels, in line with another leg lower, particularly if the pair pierces the 1.0600 threshold.
Support levels: 1.0600 1.0570 1.0530
Resistance levels: 1.0665 1.0700 1.0745