AUD/USD Forecast: Decent contention emerges around 0.6400
![]()
- AUD/USD rebounded from multi-week lows in the sub-0.6400 area.
- The Dollar’s rally faltered near recent highs.
- The Australian labour market report is due on Thursday.
The Australian Dollar (AUD) reversed three consecutive declines on Wednesday, driven by the corrective knee-jerk in the Greenback, prompting AUD/USD to revisit the 0.6435–0.6440 band.
The Aussie dollar’s climb gained momentum on the back of decreased buying pressure on the US Dollar (USD) following recent yearly highs, always amidst investors’ assessments of recent higher-than-expected US inflation figures in March and growing expectations of a delayed interest rate cut by the Federal Reserve (Fed).
The decent advance of AUD/USD was further supported by a small recovery in copper prices to around $830.00, while iron ore seems to have found some comfort around the $106.00 region, up modestly for the day.
In terms of monetary policy, the Reserve Bank of Australia (RBA) reiterated its commitment to maintaining current policies in the Minutes of its March meeting. Moreover, futures for the RBA cash rate suggest an anticipation of approximately 50 basis points of rate cuts in 2024, with the first cut potentially occurring in December.
It’s worth noting that the RBA, along with the Fed, is among the last G10 central banks expected to contemplate interest rate adjustments this year.
Given the Fed’s firm stance on tighter monetary policies and the potential for the RBA to initiate an easing cycle later in the year, the AUD/USD pair is likely to face sustained downward pressure in both the short and medium terms.
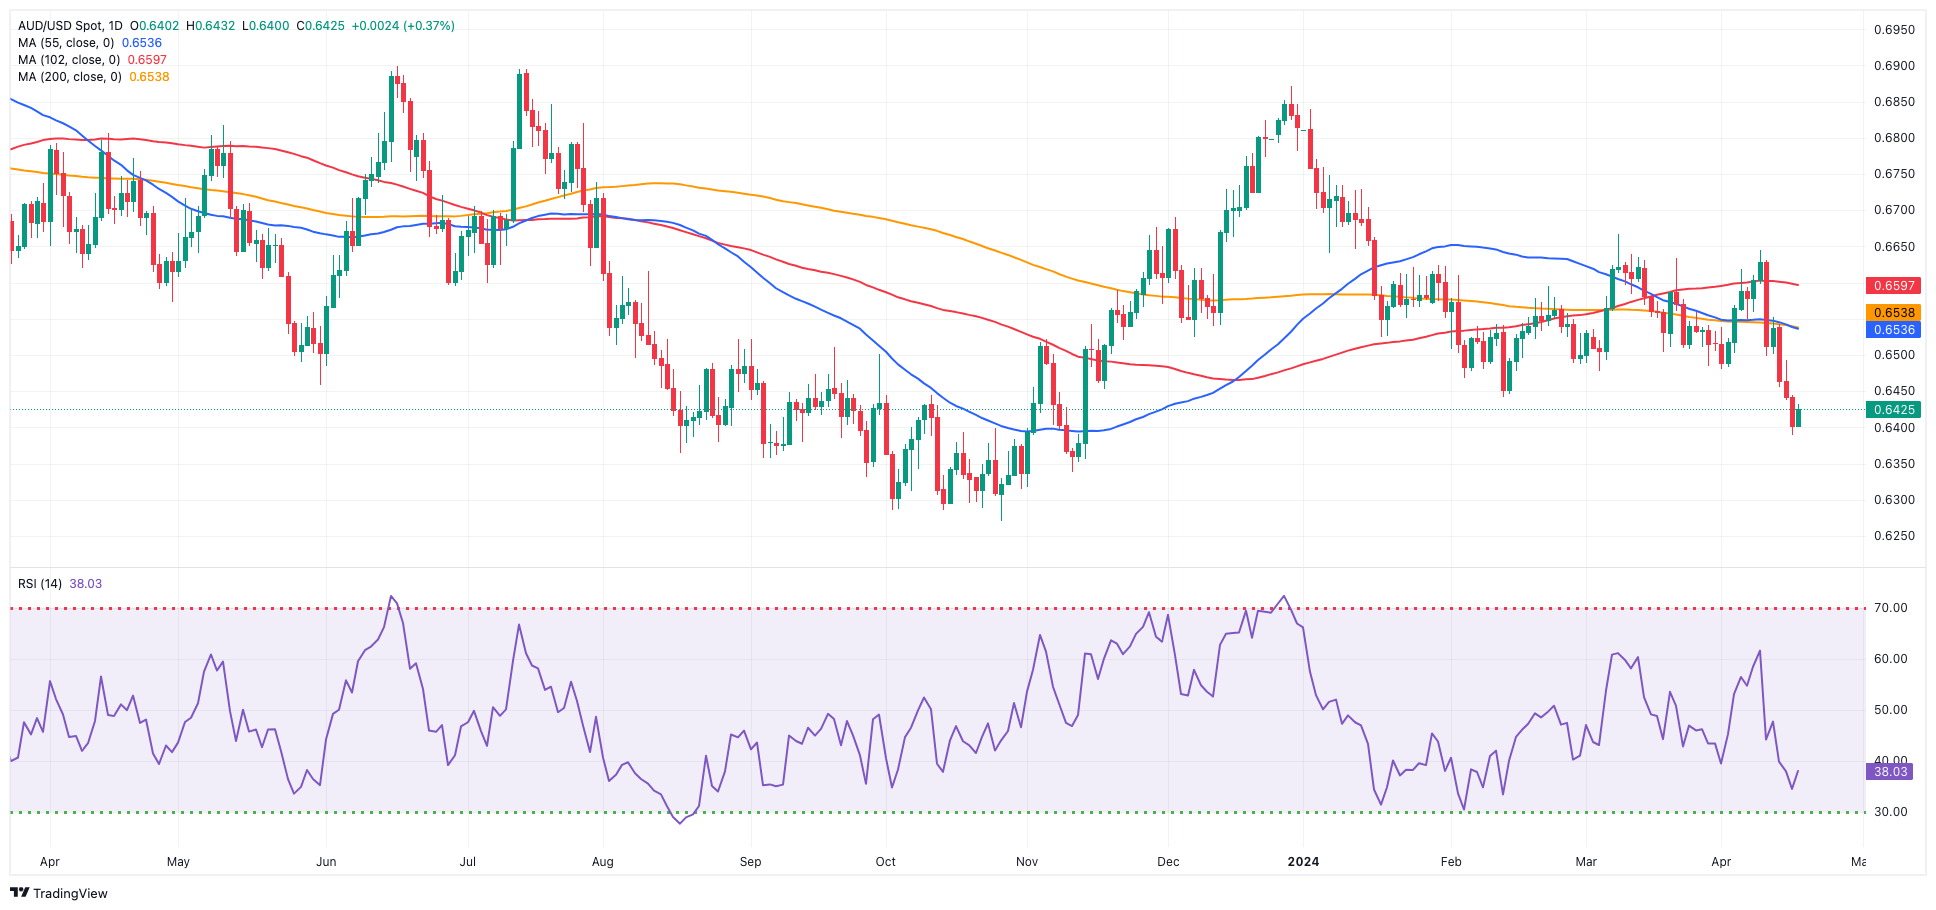
AUD/USD daily chart
AUD/USD short-term technical outlook
If sellers maintain control and AUD/USD breaches its 2024 low of 0.6389 (April 16), the pair may go back to the 2023 low of 0.6270 (October 26), before reaching the round level of 0.6200.
On the other side, there is an immediate hurdle at the critical 200-day SMA of 0.6537, which precedes the April top of 0.6644, seconded by the March peak of 0.6667 (March 8) and the December 2023 high of 0.6871. Further north, the July high of 0.6894 (July 14) comes just before the June top of 0.6899 (June 16) and the key 0.7000 level.
Looking at the big picture, the pair is projected to continue its downward trend while remaining below the important 200-day SMA.
On the 4-hour chart, the pair’s selling bias appears to be gaining momentum. Nonetheless, the initial support is around 0.6389, followed by 0.6338. On the upside, 0.6493 offers immediate resistance before 0.6552. Furthermore, the MACD remained negative, and the RSI fell to approximately 34.