XRP extends consolidation around key $0.50 level for sixth consecutive day
![]()
- XRP trades range-bound below $0.50 for a sixth consecutive day, accumulating 20% losses in the last seven days.
- Ripple is expected to file its response to the SEC’s remedies-related opening brief by April 22.
- Ripple CEO Brad Garlinghouse commented on future plans and infrastructure growth in a Fox Business interview.
Ripple (XRP) remains stuck below $0.50 after a weeklong attempt to break past this stick resistance. XRPLedger’s native token has traded sideways for the past six days, broadly ignoring the big swings seen in the main crypto assets, as traders remain focused on the developments surrounding the legal battle between the payment firm and the US Securities and Exchange Commission (SEC).
Next week, Ripple is set to file its response to the SEC’s remedies-related opening brief, which argued for punitive penalties. On Thursday, Ripple CEO Brad Garlinghouse talked about the firm’s plans to bridge traditional finance to cryptocurrency.
Daily digest market movers: Ripple CEO shares plans for XRP and stablecoin
- In an interview with Fox Business, CEO Brad Garlinghouse discussed the stablecoin sector in crypto, its projected growth and discussed Ripple’s goals.
- The cross-border payment remittance firm has been focused on bridging traditional finance with the new world and cryptocurrency, Garlinghouse said. Ripple is therefore building infrastructure to make this possible, through XRP Ledger’s native token XRP and its USD-pegged stablecoin.
- Garlinghouse commented on the regulatory uncertainty in the US and how over 90% of its clients are payment institutions outside of the United States. Ripple CEO explained that the firm sells payment solutions and infrastructure to these clients since crypto regulation remains uncertain in the US.
- The Ripple executive discussed the stablecoin bill introduced in the US Senate and said that it is a positive step in terms of regulation. The bill in question authorizes state trust companies to create and issue payment stablecoins up to $10 billion.
- Another deadline for the SEC vs. Ripple lawsuit is approaching on April 22. The payment remittance firm is set to file its response to the regulator’s remedies-related opening brief, in which the regulator requested the judge to impose Ripple nearly $2 billion in fines.
- Developments in the SEC’s lawsuit against the firm, Ripple’s plans to build crypto infrastructure and bridge it with traditional finance and Bitcoin’s upcoming halving (estimated to occur on April 20) are the three catalysts that could influence XRP price.
Technical analysis: XRP sees repeated failure in attempts to break past $0.50
XRP price is in a downtrend that started after the altcoin’s March 11 top of $0.7440. XRP has been stuck below $0.50 resistance this entire week, the altcoin is down 20% in the last seven days.
In the event that the current consolidation phase ends up with a further downside correction, XRP could find support at the weekly support level at $0.4188, which coincides with April 9 low. If this level breaks, the March 2023 low of $0.3720 could come into play.
Some technical indicators, however, are showing signs that the recent downtrend could reverse.
The Stochastic oscillator is an indicator that measures the current price of an asset relative to the price range. It is used to identify overbought and oversold conditions.
In XRP’s downtrend, the oscillator is near lows at 29.65, close to oversold. If the indicator drops below 20, it would generate a buy signal, allowing sidelined traders to open a trade and await a recovery.
Another technical indicator, the Accumulation/distribution (A/D) line, is trending up and shows buying interest while XRP price declines, meaning it is possible that traders are “buying the dip”. Sustained buying pressure could fuel a recovery in the altcoin.
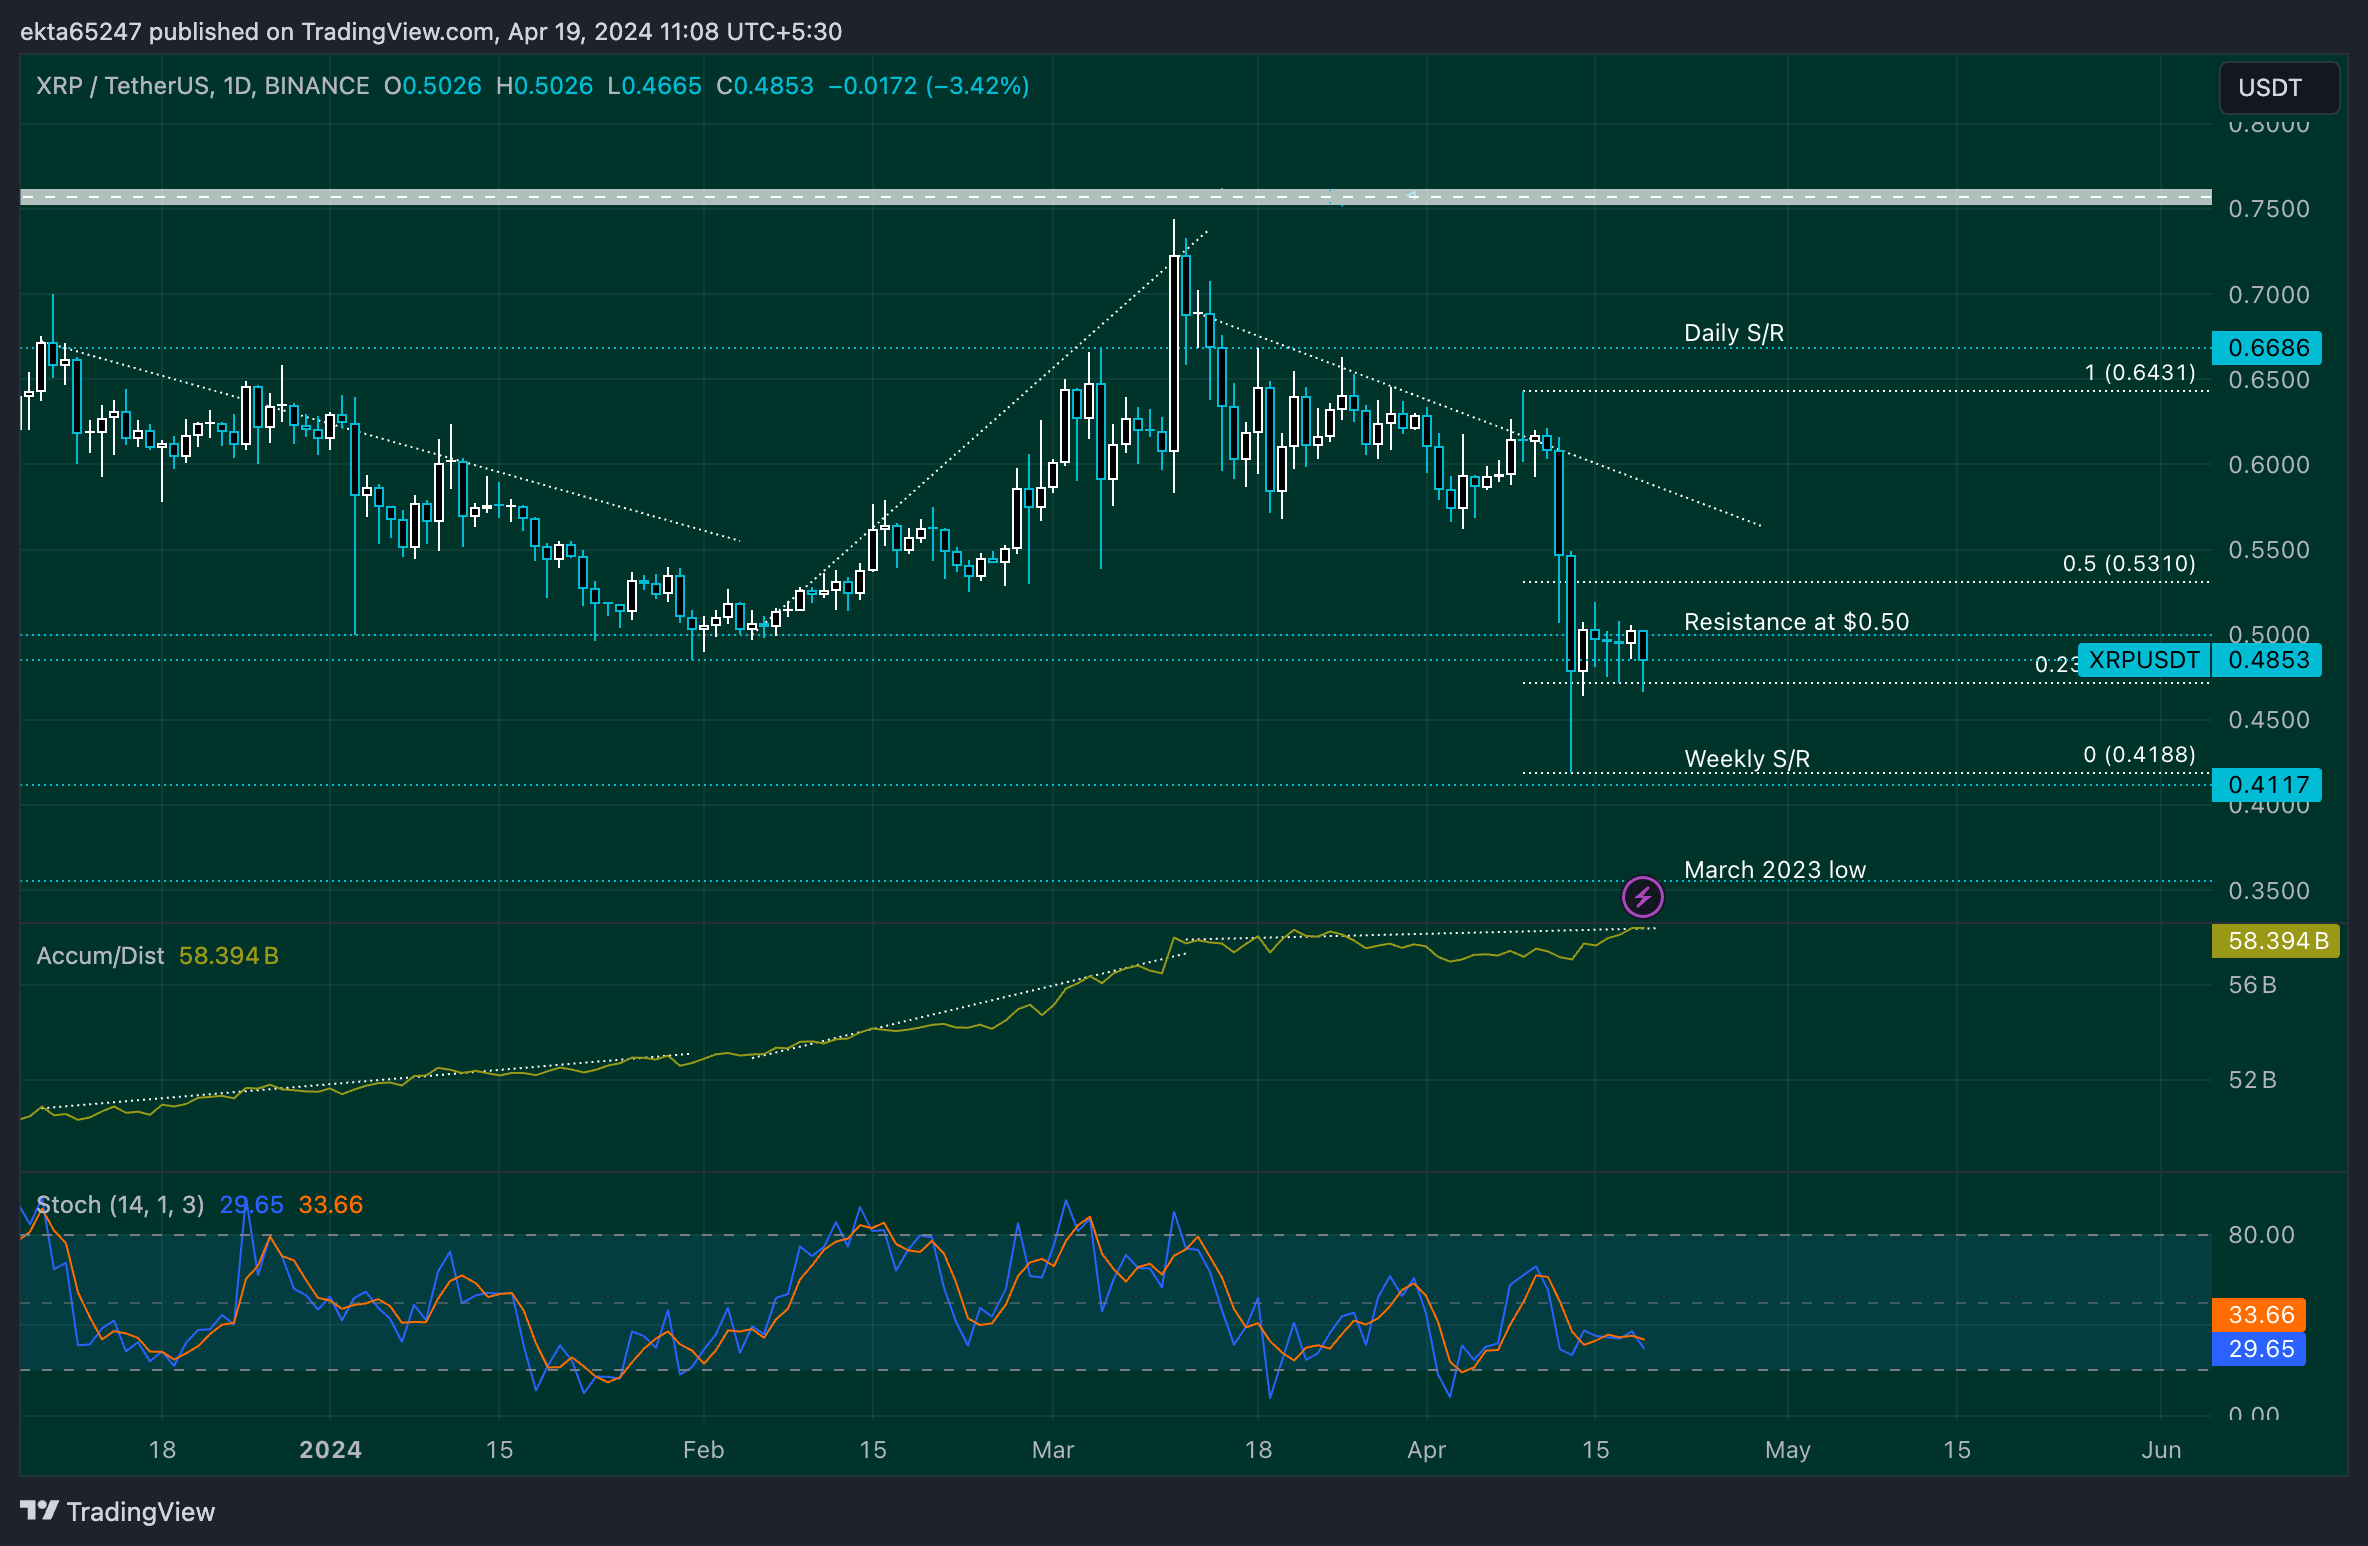
XRP/USDT 1-day chart
If XRP price successfully closes above the $0.50 level, it could invalidate the bearish thesis. The target would be the April 11 local top of $0.6431, but before that the altcoin faces resistance at $0.50, $0.5310 (the 50% Fibonacci retracement of the drop from the April 11 top of $0.6431 to the April 13 low of $0.4188), and the psychologically important $0.60 level, which acted as support for the altcoin throughout March.