US Dollar Weekly Forecast: Holding up gains amid hawkish Fed, geopolitical tensions
![]()
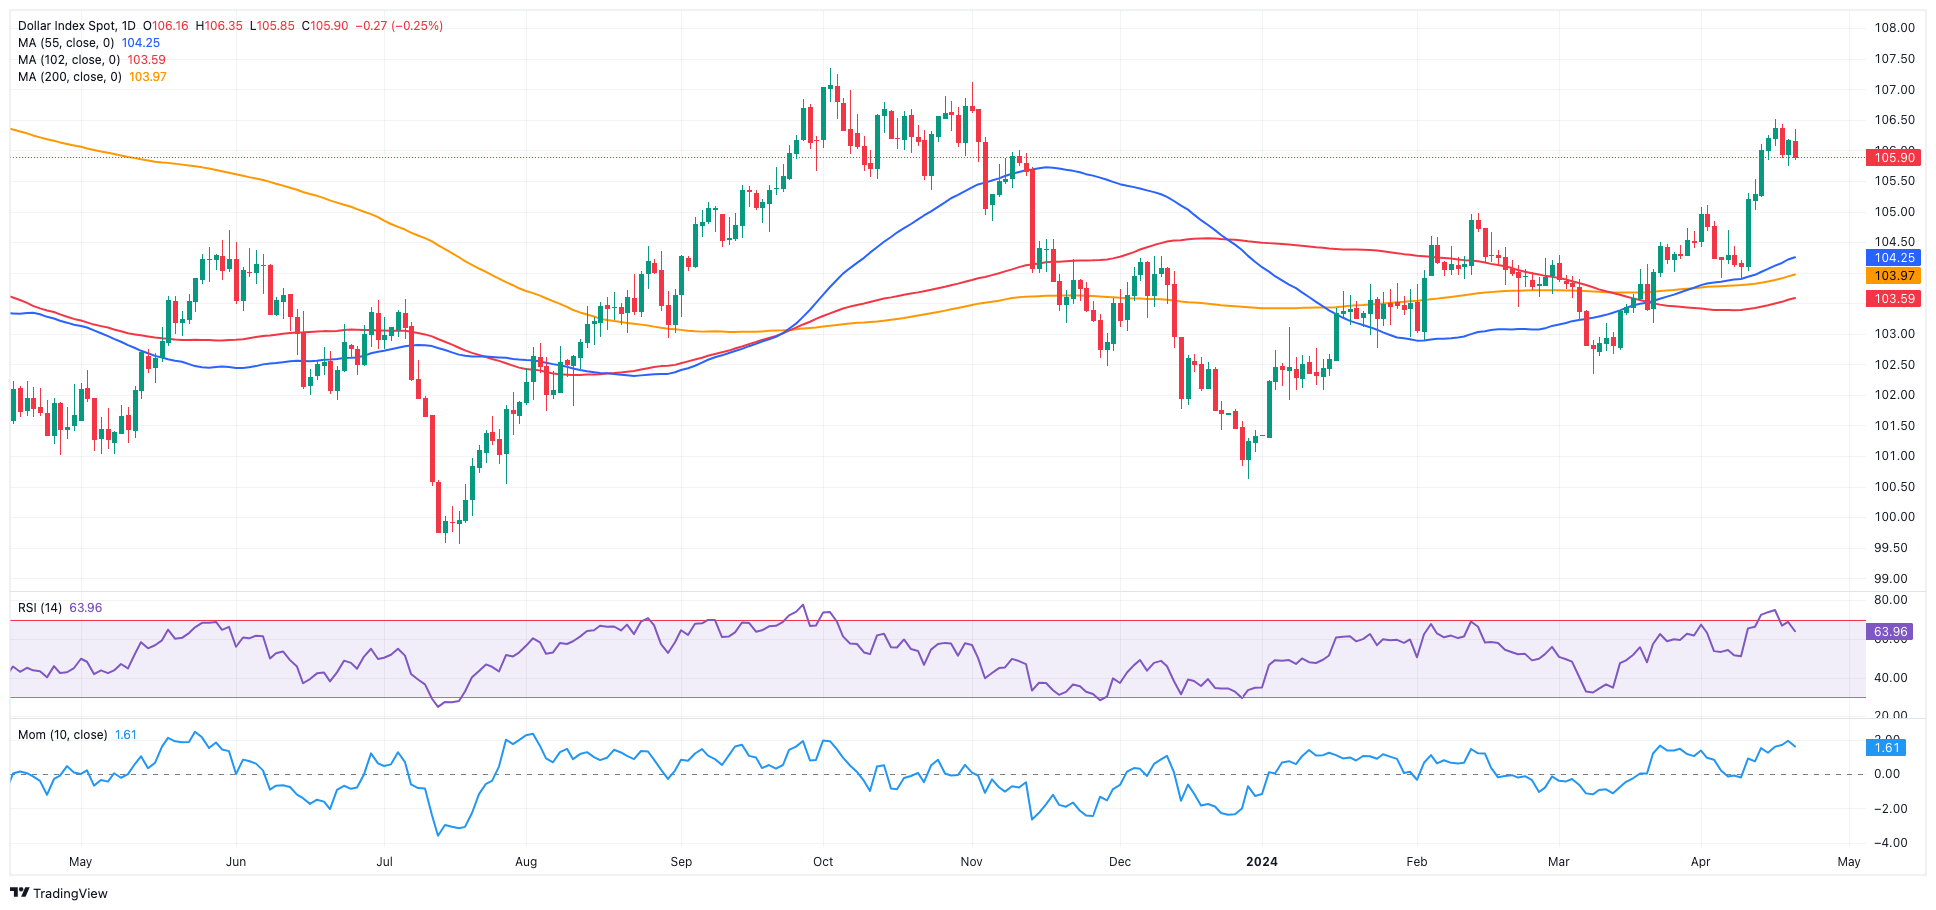
- The USD Index (DXY) met decent resistance near 106.50.
- Investors now see the Fed cutting rates in September.
- Hawkish Fedspeak and solid US economic data sustain a delay in cutting interest rates.
- The upcoming Q1 GDP figures take centre stage next week.
The Greenback ended the week barely changed after the sharp increase recorded in the previous one, despite hitting new five-month peaks in the boundaries of 106.50 when tracked by the USD Index (DXY) on April 16.
The US Dollar’s (USD) weekly price action came pari passu with further investors’ assessments of the latest release of US inflation figures after the Consumer Price Index (CPI) indicated that prices exceeded expectations in March.
The surprising slowdown in disinflationary pressures not only reinforces the enduring strength of the economy but also supports the notion that the Federal Reserve (Fed) could prolong its stance of maintaining tighter policies for an extended period.
Regarding the latter point, the likelihood of the Fed initiating its easing cycle in June has significantly diminished to approximately 16%, as indicated by the CME Group’s FedWatch Tool, while expectations for an initial rate cut in September rose above 65%.
In addition to persistent inflation, it’s important to highlight that a consistently tight labor market reinforces the perception of a robust economy, supporting the notion of a “soft landing” scenario and suggesting a delay in the expected timing of the first rate cut.
The Dollar’s weekly performance also coincided with US yields entering into a consolidative phase near recent multi-month highs, against the renewed macro environment that points to just one or no interest rate cuts for the remainder of the year.
Fed rhetoric points to decreased rate cuts
Aligned with this new view of delayed interest rate cuts by the Fed, policymakers were notably vocal throughout the week, advocating for prolonging the current restrictive stance.
Indeed, Atlanta Federal Reserve Bank President Raphael Bostic observed that US inflation is expected to reach 2% more gradually than previously anticipated, at a time when he showed no rush to cut rates, favouring in this case a potential move by year end. His colleague John Williams, New York Federal Reserve Bank President, emphasized that the Fed’s decisions are based on positive data, highlighting the strength of the economy and the mitigation of imbalances. While acknowledging the need for rate cuts, he clarified that there are no predetermined hikes, noting that if the data indicate a need for higher rates, the Fed may adjust accordingly. Additionally, Fed Governor Michelle Bowman argued that efforts to reduce inflation may have hit a snag, leaving uncertainty about whether interest rates are sufficiently high to facilitate its return to the bank’s target.
Considering the recent remarks by Chairman Jerome Powell, asserting that there’s no rush to initiate interest rate cuts, it’s unsurprising to witness a sudden and significant shift in sentiment towards the Greenback, with investors now expecting a delay of the moment that the Fed will start lowering borrowing costs.
Exploring possible interest rate trajectories
When analysing central banks and inflation dynamics within the G10 group, it is expected that the European Central Bank (ECB) would cut interest rates sometime during the summer months, potentially followed by the Bank of England (BoE). In contrast, both the Federal Reserve and the Reserve Bank of Australia (RBA) are expected to begin their easing cycles later this year, probably in the fourth quarter. Despite hiking its policy rate by 10 bps after 17 years at its March meeting, the Bank of Japan (BoJ) remains an outlier.
DXY technical outlook
In case bulls push higher, the USD Index (DXY) could confront the 2024 high at 106.51 (April 16). Surpassing this level could encourage market participants to embark on a potential visit to the November top at 107.11 (November 1) just ahead of the 2023 peak at 107.34 (October 3).
Conversely, the April bottom at 103.88 (April 9) appears underpinned by the 200-day Simple Moving Average (SMA) at 103.93. The breakdown of this region exposes the 100-day SMA at 103.61 prior to the March low at 102.35 (March 8). A deeper decline could open the door to a test of the December low of 100.61, (December 28), ahead of the psychological 100.00 barrier and the 2023 bottom at 99.57 (July 14).
Looking at the broader picture, further gains should remain in the pipeline while DXY Index trades above the key 200-day SMA.