Canadian Dollar finds further topside ahead of Tuesday’s US PMI figures
![]()
- Canadian Dollar finds room on high side as data-driven markets await US PMI print.
- Canada data remains limited until Wednesday’s CAD Retail Sales.
- Tuesday’s US PMIs expected to show a slight uptick in activity.
The Canadian Dollar (CAD) is moderately higher on Monday, trading into the green against most of its major currency peers. Monday’s thin economic calendar leaves both the Canadian Dollar and the US Dollar (USD) adrift as investors await meaningful data.
Canada brought strictly low-tier data to the table on Monday with an uptick in the Raw Materials Price Index. At the same time, Industrial Product Prices met expectations, printing higher but less than the previous figure. The Canadian New Home Price Index flattened in March, missing forecasts while retreating slightly from the same period last year.
Daily digest market movers: Canadian Dollar extends recovery in steady markets
- Monday’s Canada data saw mixed prints, but market focus remains elsewhere, giving the CAD room to run.
- Canadian Industrial Produce Prices came in at the expected 0.8% in March, easing back slightly from the previous month’s 1.1% (revised upward from 0.7%).
- The Canadian New Housing Price Index flatted in March, printing 0.0% versus the forecast steady hold at 0.1%. YoY NHPI eased back -0.4% as housing prices wobble following years of accelerated growth.
- Canada’s Raw Material Price Index jumped 3.7% in March, vaulting over the forecast 2.9% compared to February’s 2.1%.
- Canadian February Retail Sales due to print in the midweek, forecast to rebound to 0.1% on Wednesday after January’s -0.3% decline.
- Tuesday’s US S&P Global Purchasing Managers Index (PMI) will be the key data print for the early week, with the Manufacturing component forecast at 52.0 (previous 51.9) and the Services component also anticipated to print at 52.0 (last 51.7%).
- US Gross Domestic Product (GDP) and US Core Personal Consumption Expenditures (PCE) to dominate market focus in the back half of the trading week.
Canadian Dollar price today
The table below shows the percentage change of Canadian Dollar (CAD) against listed major currencies today. Canadian Dollar was the strongest against the Pound Sterling.
| USD | EUR | GBP | CAD | AUD | JPY | NZD | CHF | |
| USD | 0.02% | 0.17% | -0.31% | -0.35% | 0.11% | -0.32% | 0.02% | |
| EUR | -0.02% | 0.14% | -0.32% | -0.37% | 0.10% | -0.32% | -0.01% | |
| GBP | -0.17% | -0.14% | -0.47% | -0.52% | -0.04% | -0.47% | -0.16% | |
| CAD | 0.30% | 0.32% | 0.46% | -0.06% | 0.42% | -0.01% | 0.32% | |
| AUD | 0.35% | 0.36% | 0.52% | 0.06% | 0.48% | 0.04% | 0.36% | |
| JPY | -0.11% | -0.08% | 0.05% | -0.43% | -0.48% | -0.42% | -0.10% | |
| NZD | 0.31% | 0.34% | 0.47% | 0.01% | -0.04% | 0.43% | 0.34% | |
| CHF | -0.01% | 0.00% | 0.15% | -0.31% | -0.35% | 0.10% | -0.32% |
The heat map shows percentage changes of major currencies against each other. The base currency is picked from the left column, while the quote currency is picked from the top row. For example, if you pick the Euro from the left column and move along the horizontal line to the Japanese Yen, the percentage change displayed in the box will represent EUR (base)/JPY (quote).
Technical analysis: Canadian Dollar mounting a slow recovery, sights on 1.3700
The Canadian Dollar was broadly higher on Monday, gaining almost half of a percent against the Pound Sterling (GBP) and the Swiss Franc (CHF), as well as climbing around a third of a percent against the Euro (EUR) and the Japanese Yen (JPY). The CAD is outperformed by the Australian Dollar (AUD) and the New Zealand Dollar (NZD) as the Antipodeans recover recently lost ground.
The USD/CAD pair fell from last week’s peak of 1.3840, and a bullish recovery attempt fell short after a bearish rejection from the 1.3800 handle. The pair cracked 1.3700 to the low side, which will clear the way for a push toward a supply zone near 1.3550 as the Loonie leaks below technical support at the 200-hour Exponential Moving Average (EMA) near 1.3730.
Looking longer-term, daily candlesticks have the USD/CAD pair poised for a fourth consecutive down day as the Canadian Dollar extends a near-term recovery. The Greenback failed to recapture November’s highs near 1.3900, and momentum threatens to return USD/CAD back to heavy congestion at the 200-day EMA just above the 1.3500 handle.
USD/CAD hourly chart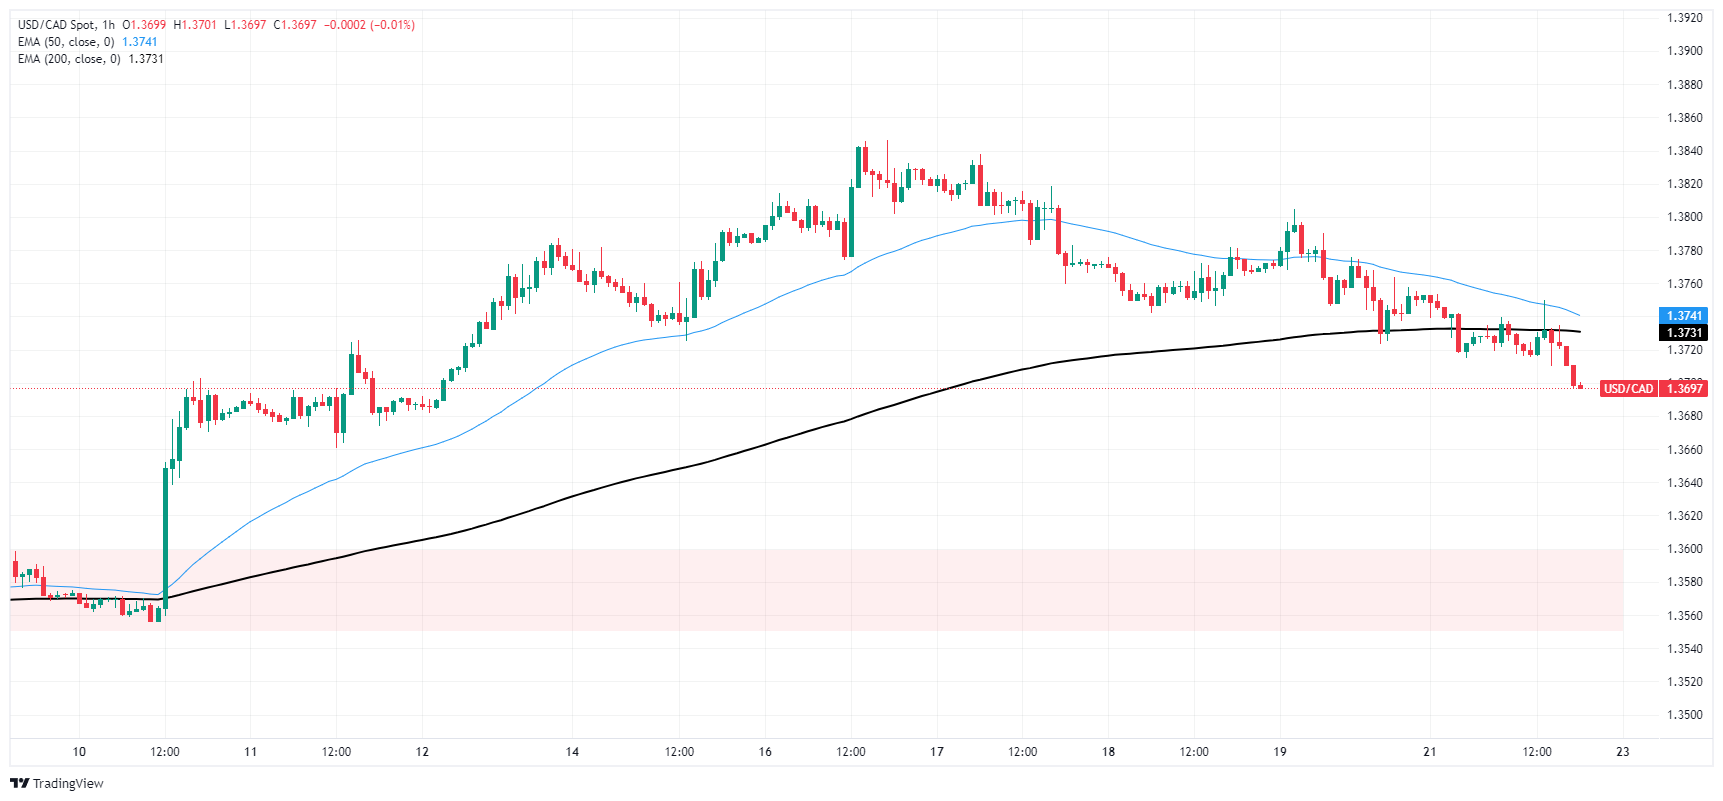
USD/CAD daily chart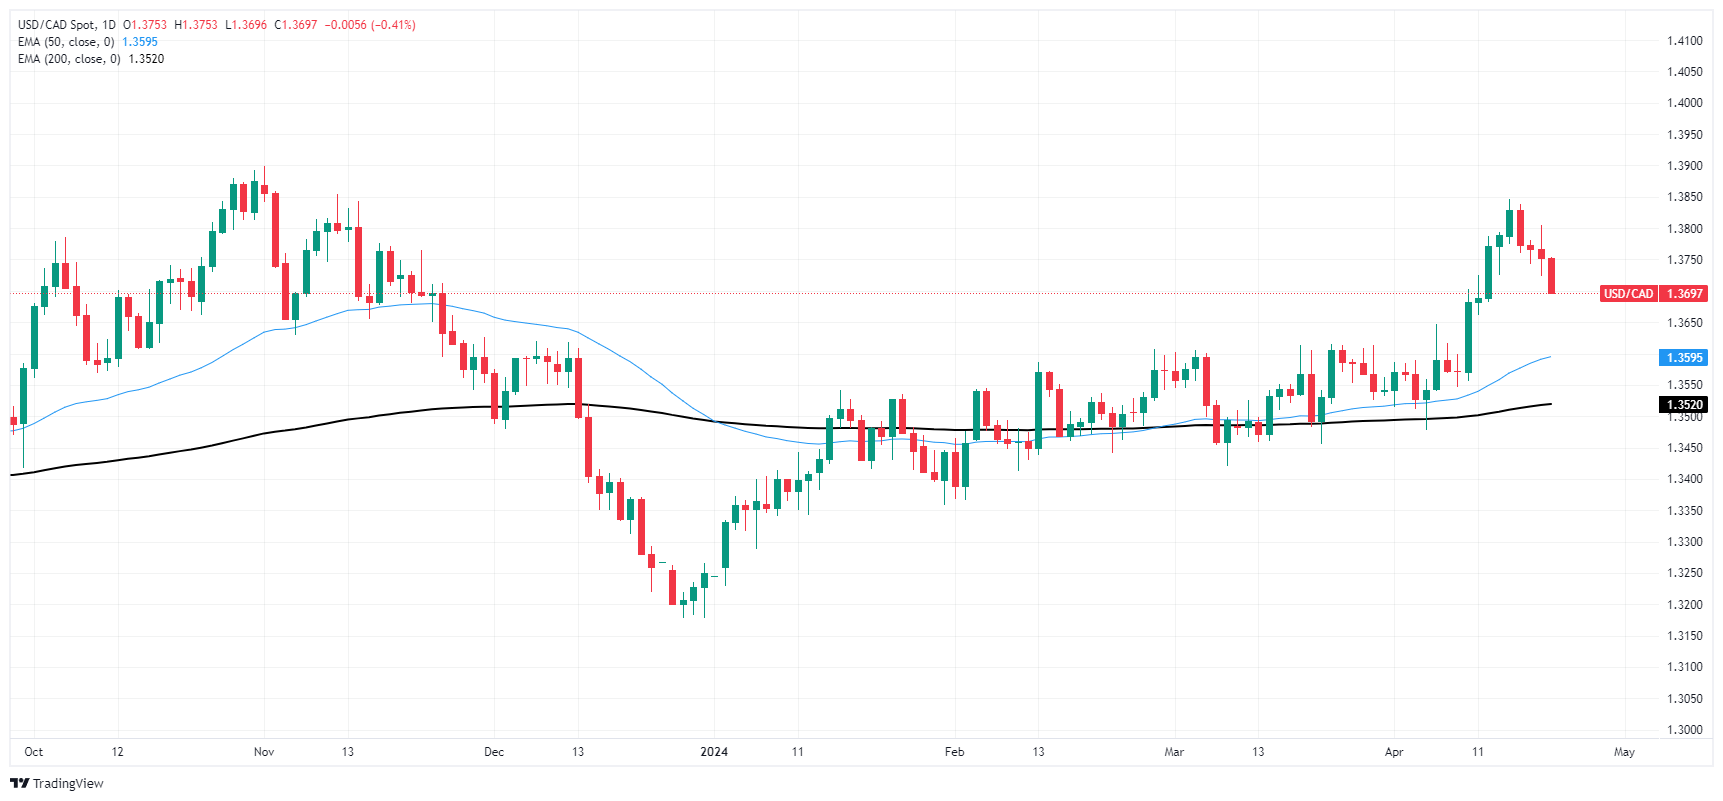
US Dollar FAQs
The US Dollar (USD) is the official currency of the United States of America, and the ‘de facto’ currency of a significant number of other countries where it is found in circulation alongside local notes. It is the most heavily traded currency in the world, accounting for over 88% of all global foreign exchange turnover, or an average of $6.6 trillion in transactions per day, according to data from 2022. Following the second world war, the USD took over from the British Pound as the world’s reserve currency. For most of its history, the US Dollar was backed by Gold, until the Bretton Woods Agreement in 1971 when the Gold Standard went away.
The most important single factor impacting on the value of the US Dollar is monetary policy, which is shaped by the Federal Reserve (Fed). The Fed has two mandates: to achieve price stability (control inflation) and foster full employment. Its primary tool to achieve these two goals is by adjusting interest rates. When prices are rising too quickly and inflation is above the Fed’s 2% target, the Fed will raise rates, which helps the USD value. When inflation falls below 2% or the Unemployment Rate is too high, the Fed may lower interest rates, which weighs on the Greenback.
In extreme situations, the Federal Reserve can also print more Dollars and enact quantitative easing (QE). QE is the process by which the Fed substantially increases the flow of credit in a stuck financial system. It is a non-standard policy measure used when credit has dried up because banks will not lend to each other (out of the fear of counterparty default). It is a last resort when simply lowering interest rates is unlikely to achieve the necessary result. It was the Fed’s weapon of choice to combat the credit crunch that occurred during the Great Financial Crisis in 2008. It involves the Fed printing more Dollars and using them to buy US government bonds predominantly from financial institutions. QE usually leads to a weaker US Dollar.
Quantitative tightening (QT) is the reverse process whereby the Federal Reserve stops buying bonds from financial institutions and does not reinvest the principal from the bonds it holds maturing in new purchases. It is usually positive for the US Dollar.