GBP/USD Forecast: Pound Sterling loses recovery momentum ahead of US data
![]()
- GBP/USD retreated below 1.2450 in the European session on Wednesday.
- The near-term technical outlook points to a loss of recovery momentum.
- Buyers could remain interested in case 1.2400 holds as support.
After moving sideways above 1.2450 in the Asian session on Wednesday, GBP/USD lost its traction and declined below this level. The near-term technical outlook suggests that the pair has lost its recovery momentum but buyers could remain interested as long as 1.2400 support stays intact.
Pound Sterling price this week
The table below shows the percentage change of Pound Sterling (GBP) against listed major currencies this week. Pound Sterling was the strongest against the Swiss Franc.
| USD | EUR | GBP | CAD | AUD | JPY | NZD | CHF | |
| USD | -0.30% | -0.47% | -0.43% | -1.25% | 0.19% | -0.64% | 0.35% | |
| EUR | 0.30% | -0.17% | -0.15% | -0.92% | 0.48% | -0.32% | 0.65% | |
| GBP | 0.47% | 0.18% | 0.02% | -0.77% | 0.66% | -0.17% | 0.82% | |
| CAD | 0.44% | 0.15% | -0.03% | -0.79% | 0.63% | -0.20% | 0.78% | |
| AUD | 1.23% | 0.91% | 0.76% | 0.77% | 1.34% | 0.59% | 1.56% | |
| JPY | -0.18% | -0.48% | -0.66% | -0.61% | -1.42% | -0.82% | 0.17% | |
| NZD | 0.64% | 0.34% | 0.16% | 0.19% | -0.59% | 0.77% | 0.95% | |
| CHF | -0.35% | -0.65% | -0.82% | -0.80% | -1.58% | -0.17% | -0.99% |
The heat map shows percentage changes of major currencies against each other. The base currency is picked from the left column, while the quote currency is picked from the top row. For example, if you pick the Euro from the left column and move along the horizontal line to the Japanese Yen, the percentage change displayed in the box will represent EUR (base)/JPY (quote).
The broad-based selling pressure surrounding the US Dollar (USD) provided a boost to GBP/USD in the second half of the day on Tuesday, allowing the pair to snap a three-day losing streak.
The S&P Global Composite PMI in the US declined to 50.9 in April’s flash estimate from 52.1 in March, showing that the business activity in the private sector expanded at a softening pace. Furthermore, the details of the PMI survey highlighted easing price pressures.
“The deterioration of demand and cooling of the labor market fed through to lower price pressures, as April saw a welcome easing in rates of increase for selling prices for both goods and services,” said Chris Williamson, Chief Business Economist at S&P Global Market Intelligence.
March Durable Goods Orders data from the US will be looked upon for fresh impetus later in the day. Although this has not been a market-moving data recently, the market reaction to Tuesday’s disappointing PMI report suggests that a weak print could weigh on the USD.
GBP/USD Technical Analysis
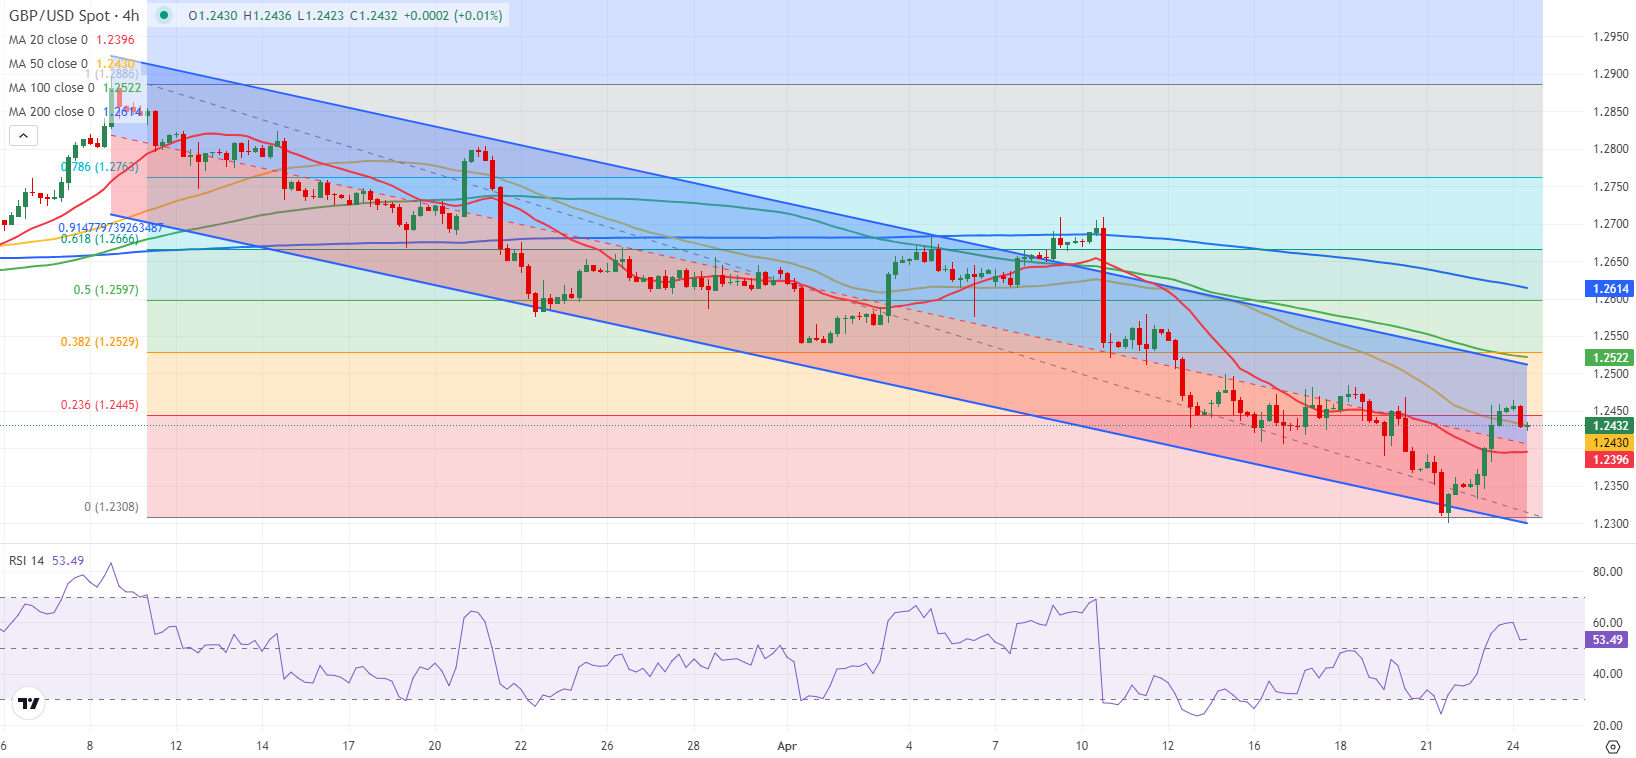
The Relative Strength Index (RSI) indicator on the 4-hour chart declined toward 50, reflecting a loss of bullish momentum. Additionally, GBP/USD declined toward the 50-period Simple Moving Average (SMA), currently located at 1.2430, after closing the previous three 4-hour candles above this level.
The mid-point of the descending channel aligns as first support at 1.2400. If GBP/USD holds steady above this level, a fresh leg higher toward 1.2500 (100-period SMA, upper limit of the descending channel) could be seen. On the downside, a 4-hour close below 1.2400 could open the door for an extended slide toward 1.2350 (static level) and 1.2300 (static level, lower limit of the descending channel).