GBP/USD Forecast: Pound Sterling could face strong resistance at 1.2560
- GBP/USD stays in a consolidation phase above 1.2500 early Friday.
- The technical picture suggests that the bullish bias remains intact.
- The 200-day SMA aligns as strong resistance at 1.2560.
GBP/USD closed the third consecutive day in positive territory on Thursday and climbed to its highest level in two weeks at 1.2540 early Friday. The pair retreated toward 1.2500 in the European session but the technical outlook suggests that the bullish bias remains intact.
The US Dollar (USD) weakened against its rivals after disappointing US data on Thursday. The US’ Gross Domestic Product (GDP) expanded at an annual rate of 1.6% in the first quarter. This reading followed the 3.4% growth recorded in the last quarter of 2023 and came in below the market expectation for an expansion of 2.5%.
Early Friday, the positive shift seen in risk mood doesn’t allow the USD to gather strength and helps GBP/USD hold its ground. At the time of press, S&P Futures were up 0.65% on the day. In case Wall Street’s main indexes open decisively higher, the USD could come under renewed selling pressure in the American session.
The US Bureau of Economic Analysis (BEA) will release the Personal Consumption Expenditures (PCE) Price Index data for March later in the day. On Thursday, the BEA said in the GDP report that the PCE Price Index rose 3.4% on a quarterly basis in the first quarter.
The CME FedWatch Tool shows that markets see a nearly 90% chance that the Federal Reserve (Fed) will leave the policy rate unchanged in June. Given that investors already saw the quarterly change in the PCE Price Index, the monthly data is unlikely to influence the Fed’s rate outlook in a meaningful way. Hence, the market reaction to the monthly PCE inflation print could remain short-lived.
GBP/USD Technical Analysis
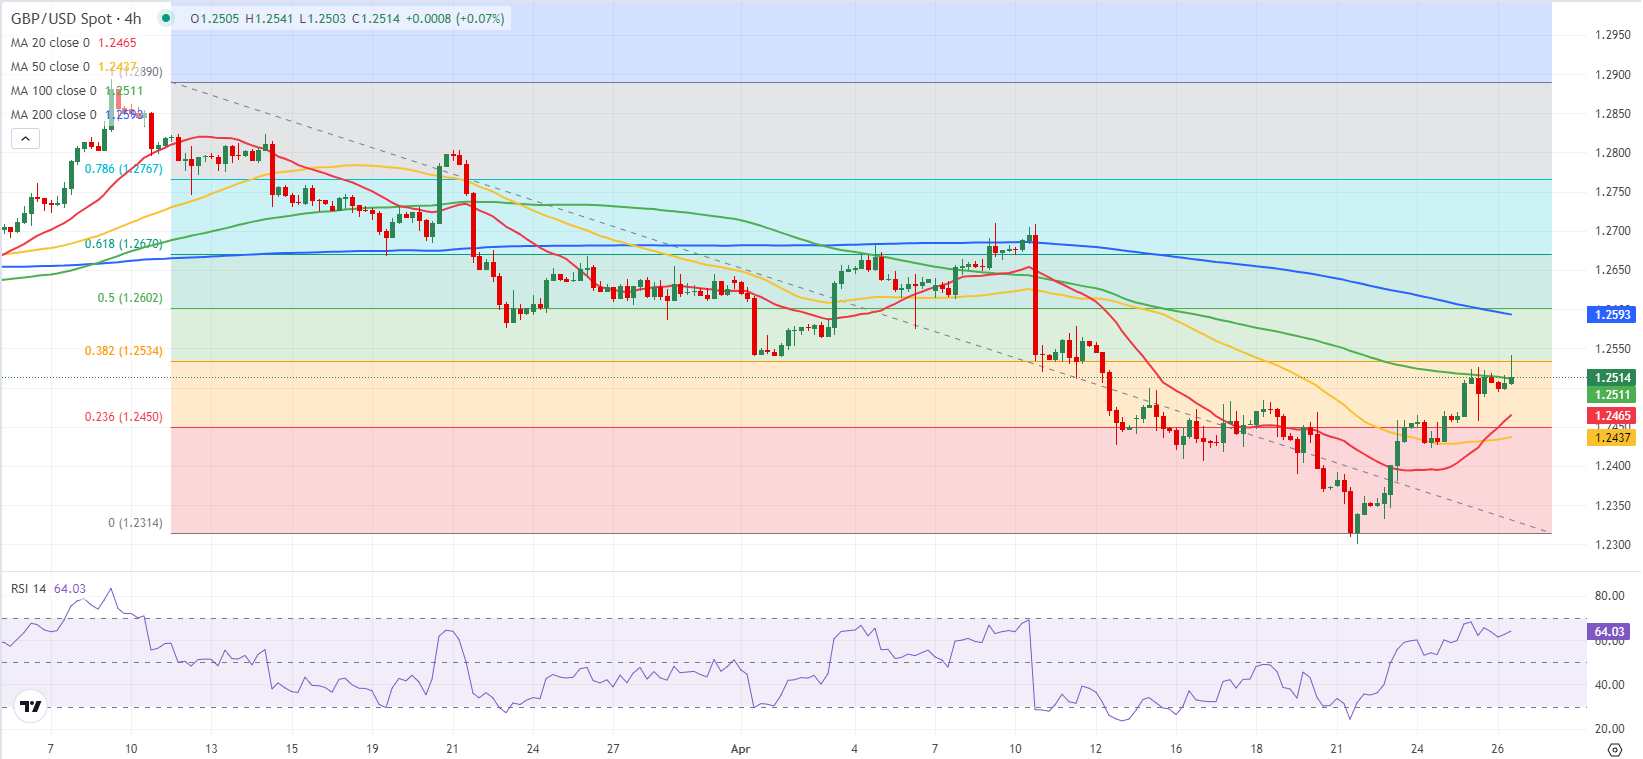
The Relative Strength Index on the 4-hour chart stays above 60 and the gap between the 20-period and the 50-period Simple Moving Averages (SMA) continues to widen following the bullish cross, highlighting the bullish bias.
On the upside, 1.2530 (Fibonacci 38.2% retracement of the latest downtrend) aligns as immediate resistance before 1.2560 (200-day SMA). Supports are located at 1.2450 – 1.2440 (Fibonacci 23.6% retracement, 50-period SMA) and 1.2400 (psychological level, static level).


