this is just a quick example (before/after) to spot Divergences and trade them.
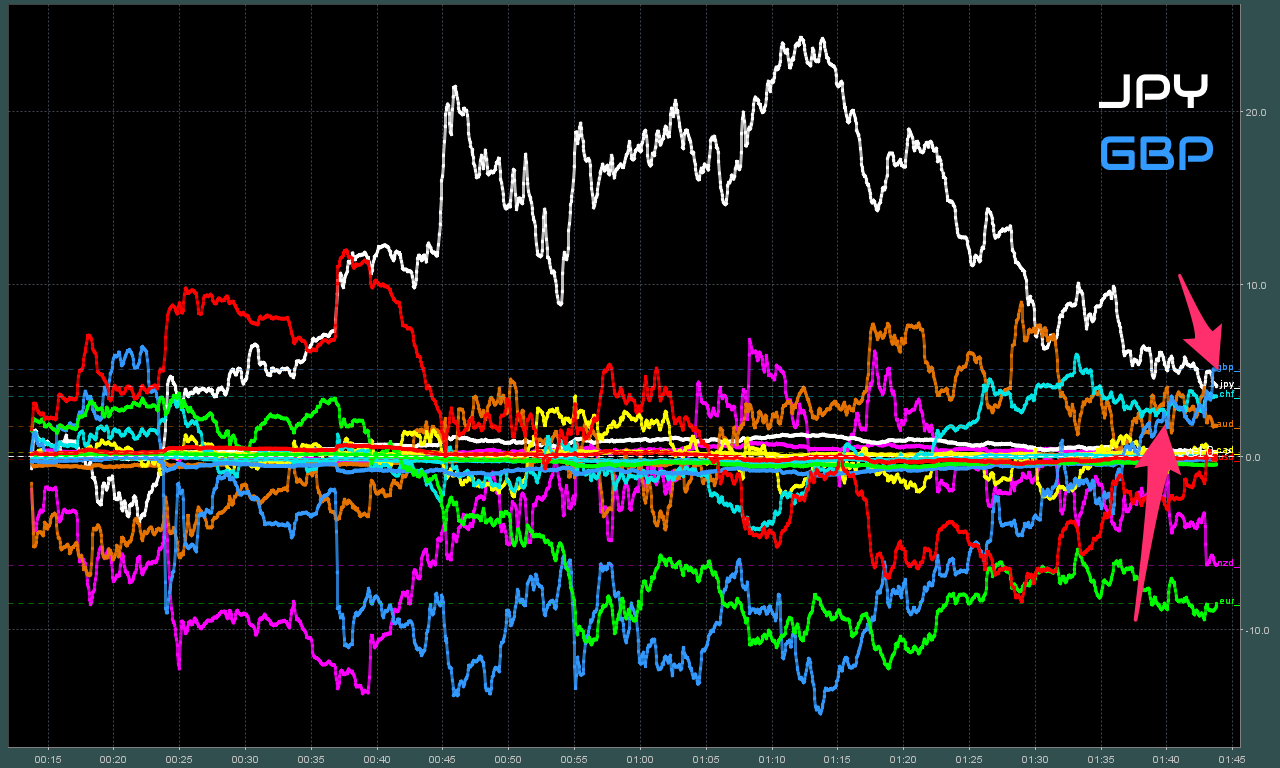
the idea was to Sell xx/JPY (Buy Japanese Yen)
Step 1: look at the Divergence (large and small) chart to find out which one is the best to trade.

Step 2: find entry apply structural stops

Step 3: find exit when the difference narrows down or one reaches the ZERO Level

this does show when momentum is lost, or the difference between the currencies itself is level-out.
does not mean the move is over, but the initial momentum can be considered gone, a good place for a partial exit or complete exit on a nearby structure, if other like (USD/GPB lign up in the meanwhile this could be a sign of continuation, or a pullback to happen that would allow a scale in
the confirmation for USD to continue, scaling in the pullback instead of exiting position


things to note:
- Divergence data can be collected in multiple ways,
however, comparing currency symbols (like mot indicators do it) is a very dirty way and get’s you polluted information. - SwingFish uses data with permission from xscalp.com
- Structure matters!
none of these things will work if you do not respect and use Structural information
(the charts/trade what you see) to find stop/profit levels.