USD/CHF Price Analysis: Double-top chart pattern around 0.9260s looms
![]()
- The USD/CHF continues advancing for the second straight day, up 0.09%.
- A risk-on market mood weakens safe-haven currencies except for the USD, which gains against the CHF.
- USD/CHF Price Forecast: Failure at 0.9268 would form a double-top pattern that would open the way for further losses.
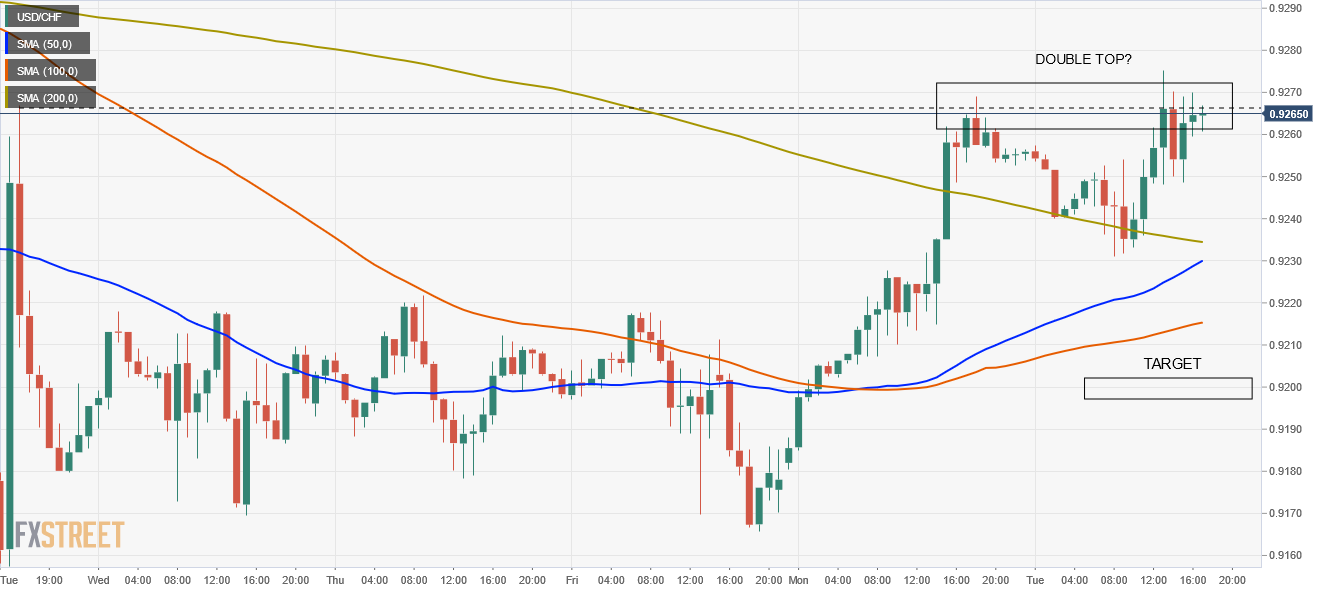
The USD/CHF extends to two-consecutive days of gains, trading at 0.9265 during the New York session at the time of writing. In the overnight session, the USD/CHF edged lower to re-test the 200-hour simple moving average (SMA) around 0.9230s, then bounced off amid positive market mood, as the omicron variant, although contagious, cases linked to the newly discovered strain cause mild symptoms in patients. Additionally, treatment of an omicron-effective antibody boost created by Glaxo abates market participants’ worries, as global equities have risen on Tuesday.
Apart from that, the US Dollar Index, which tracks the greenback’s performance against a basket of rivals, advances 0,12%, sitting at 96.45, a tailwind for the USD/CHF, as safe-haven currencies, like the JPY and the CHF, weaken against the buck.
The US 10-year Treasury yield follows the DXY footsteps, rising almost two-basis points, up to 1.45%.
USD/CHF Price Forecast: Technical outlook
In the 1-hour chart, the USD/CHF is re-testing the November 30 high at 0.9266, resulting from a 100-pip upward move on that day. Furthermore, the December 6 high at 0.9268 coincided with the abovementioned, making that price level a crucial line of defense for CHF bulls.
At press time, the pair is testing the resistance abovementioned, which in the outcome of being broken would expose the figure at 0.9300. The breach of the latter would exert upward pressure on the pair. The following resistance would be the November 25 support-turned-resistance at 0.9324, followed by the November 26 high at 0.9360.
On the flip side, failure at 0.9260s would form a double top chart pattern that could send the USD/CHF tumbling lower. The first support would be the 200-hour SMA at 0.92323. A break of that level would expose crucial support areas like the confluence of the 50-hour SMA and the central daily pivot at 0.9229, followed by the 100-hour SMA at 0.9214.