USD/TRY Price Analysis: Rising wedge teases sellers, $13.25 in focus
![]()
- USD/TRY consolidates recent losses inside bearish chart pattern.
- Receding bullish bias of MACD, downside break of 5-DMA suggest pullback.
- 10-DMA adds strength to $13.25 support level, weekly resistance line offers extra hurdle to the north.
USD/TRY hovers around $13.55, up 0.55% intraday during early Wednesday morning in Europe.
The Turkish lira (TRY) pair dropped the most in a week the previous day while breaking the 5-DMA support. That said, the quote remains inside a two-week-old rising wedge bearish formation.
Also keeping the pair sellers hopeful is the receding bullish bias of the MACD and overbought RSI conditions.
Even so, the 10-DMA toughens the $13.25 support and challenge short-term sellers, a break of which will confirm the bearish chart pattern suggesting a slump towards sub $11.00 region.
During the fall, a November 24 low of $11.57 may offer an intermediate halt whereas October’s peak surrounding $9.40 will lure the USD/TRY bears afterward.
On the contrary, a clear upside break of 5-DMA, around $13.65 at the latest, will push the pair towards a one-week-old descending trend line near $13.90.
In a case where the USD/TRY rises beyond $13.90, the $14.00 round figure and the upper line of the stated wedge close to $14.50, will be in focus.
USD/TRY: Daily chart
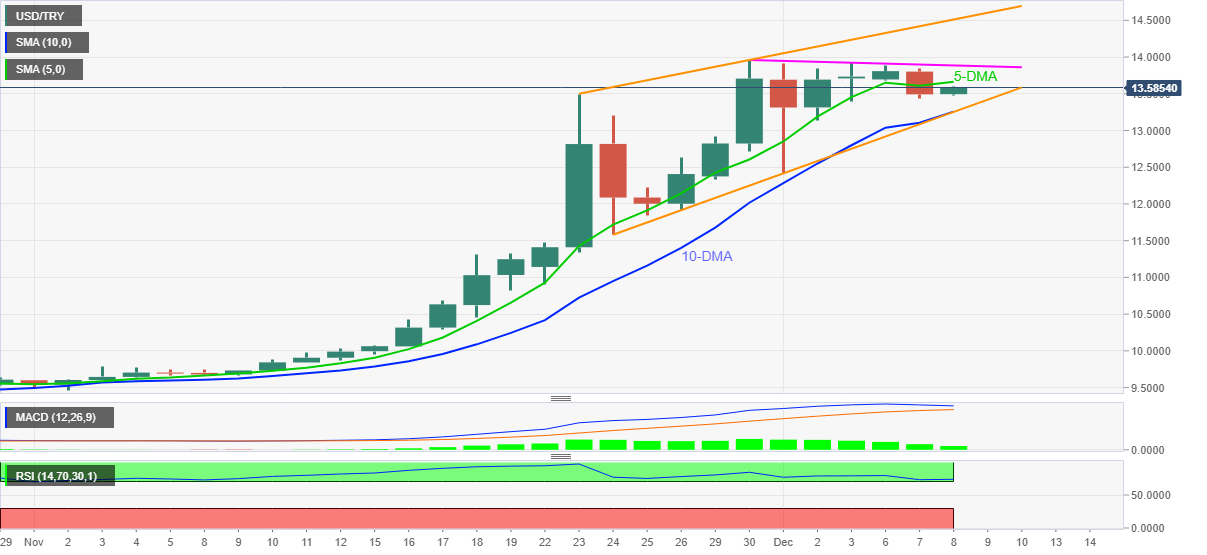
Trend: Pullback expected