Shiba Inu price could print new all-time lows if this Elliott Wave fractal reignites
![]()
- Shiba Inu price is falling on a steep decline.
- Elliott wave fractal could forecast a sweep of the lows event.
- Invalidation of the bearish downtrend is a breach at $0.00002225
Shiba Inu price could set up a massibe bulltrap in the coming weeks. Traders and investors could benefit from being aware of this this very possible macro scenario.
Shiba Inu price has good and bad news
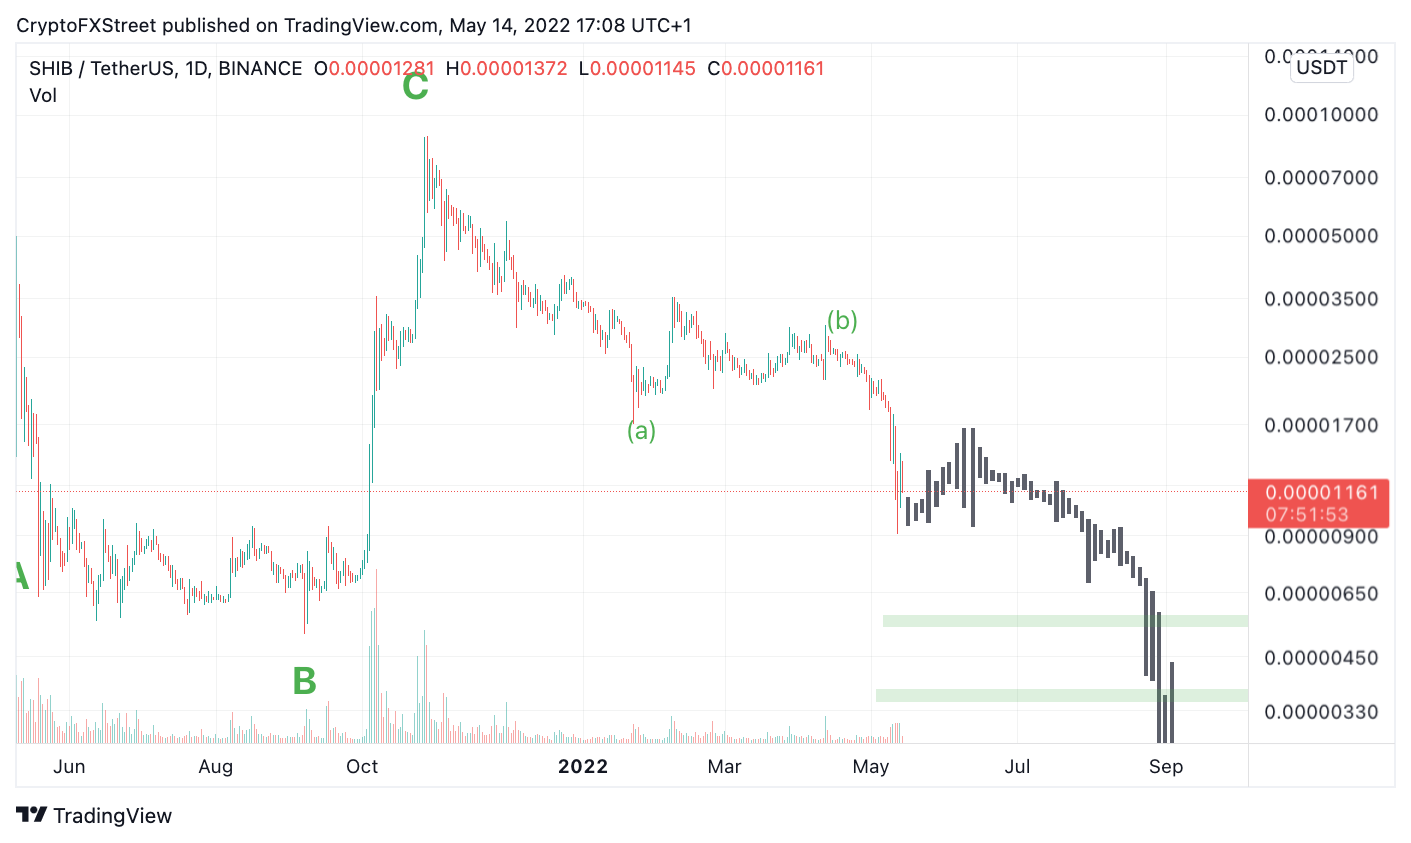
Shiba Inu price is inching towards the all-time lows at $0.00000510 that occurred in September of 2021. Because the price is only 50% away from the level, calculating a scenario on how the liquidity hunt could occur could save long-term investors from financial devestation. Shiba Inu price has fractal waves within the daily and weekly chart that contract for short periods before sending the popular meme coin into a straight-lined rally.
Using the fractal wave projection, Shiba Inu price action could retrace 50-70% higher towards the $0.00001600. That’s the good news. This also confounds the market sentiment in the crypto space as a counter highly anticipated since this week’s devastating sell-off. The bad news is the next corrective rally could be a bridge between the final leg down within the unfolding zigzag c wave set to breach the lows. The price targets for the final c leg down lie at $0.00000570, $0.00000350 and $0.00000185
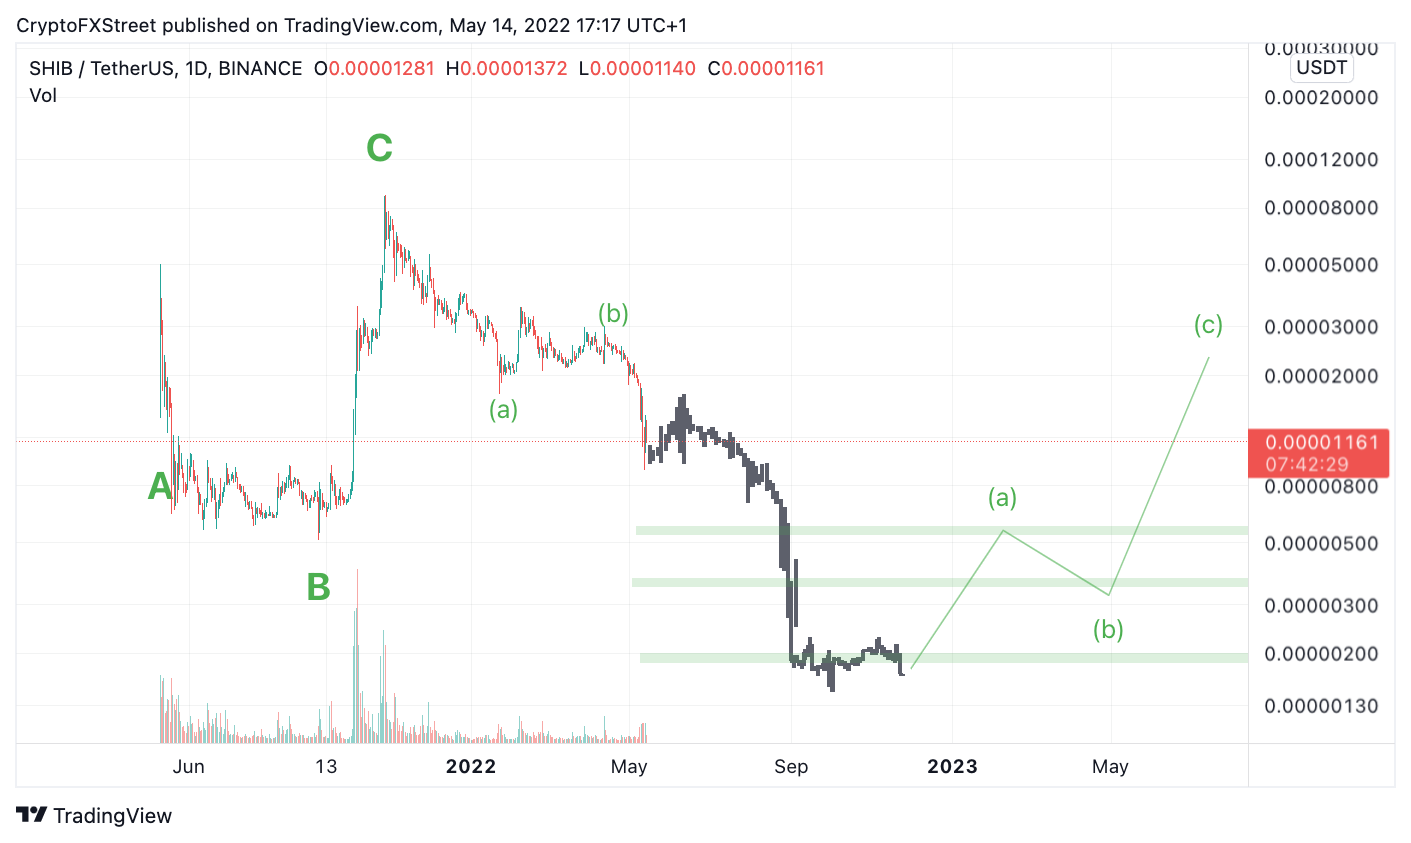
SHIB/USDT 1-Day Chart
Still, there is always room for alternate counts and sudden changes in price action. The best invalidation for the bearish scenario will be a breach above $0.00002225. If this were to occur, the zigzag impulse would be deemed terminated. The bulls could reconcile the trend and aim for $0.00003800, resulting in a 275 % increase from the current Shiba Inu price.
SHIB/USDT 1-Dau Chart