US Dollar Index Technical Analysis: DXY finishing the week on its highs near 97.40 key resistance
![]()
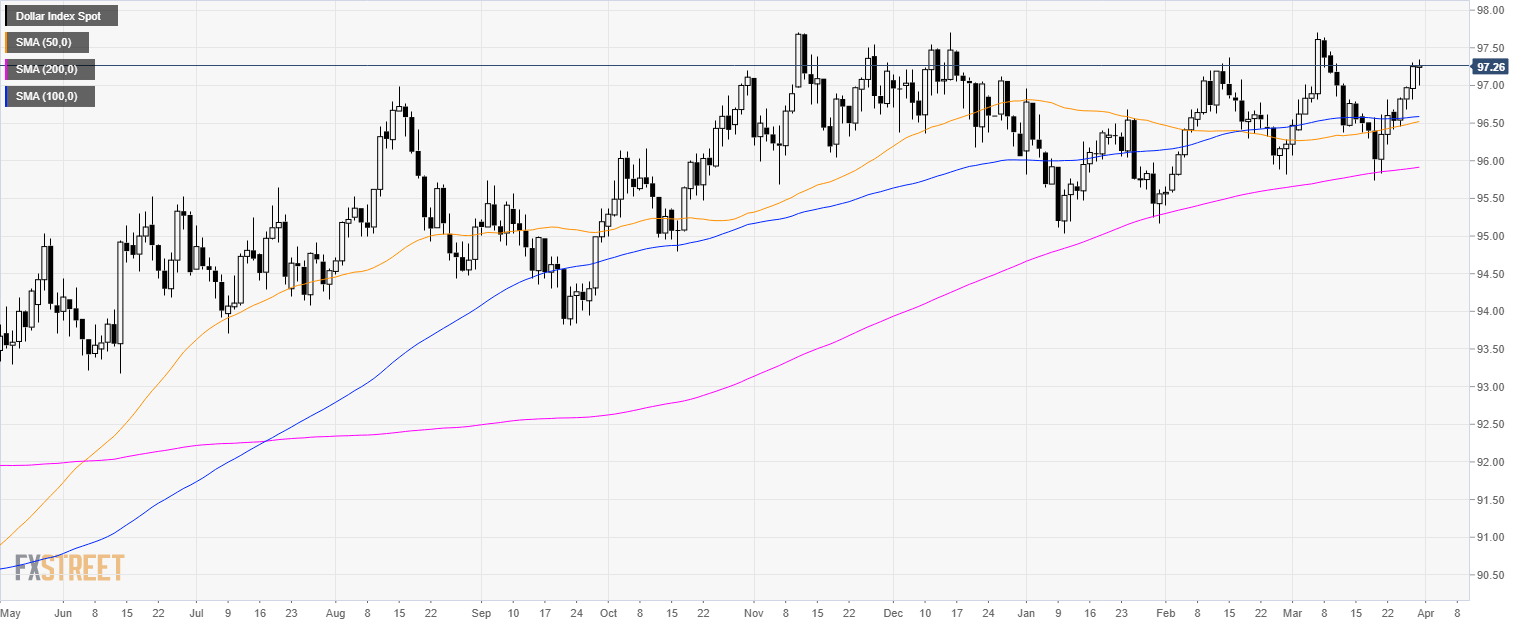
DXY daily chart
- The US Dollar Index (DXY) is trading in a bull trend above its 200-day simple moving average (SMA).
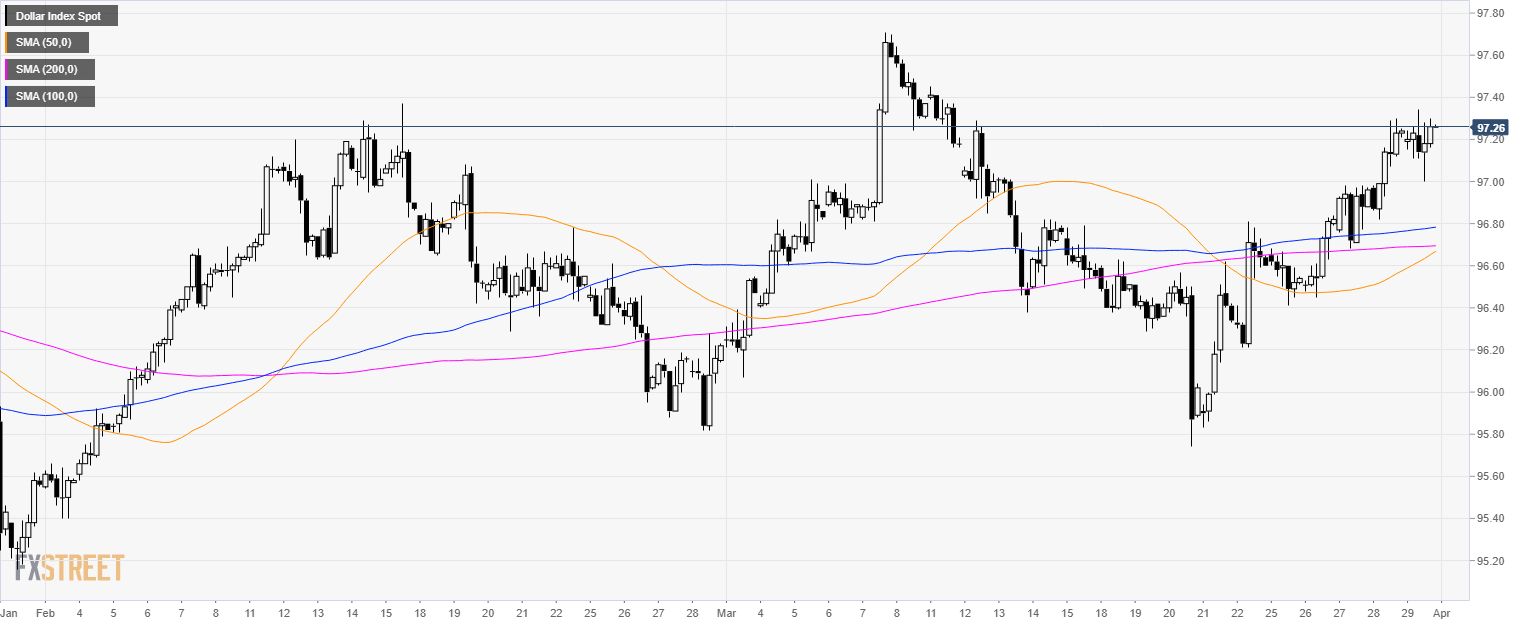
DXY 4-hour chart
- DXY is trading above its main SMAs suggesting bullish momentum.
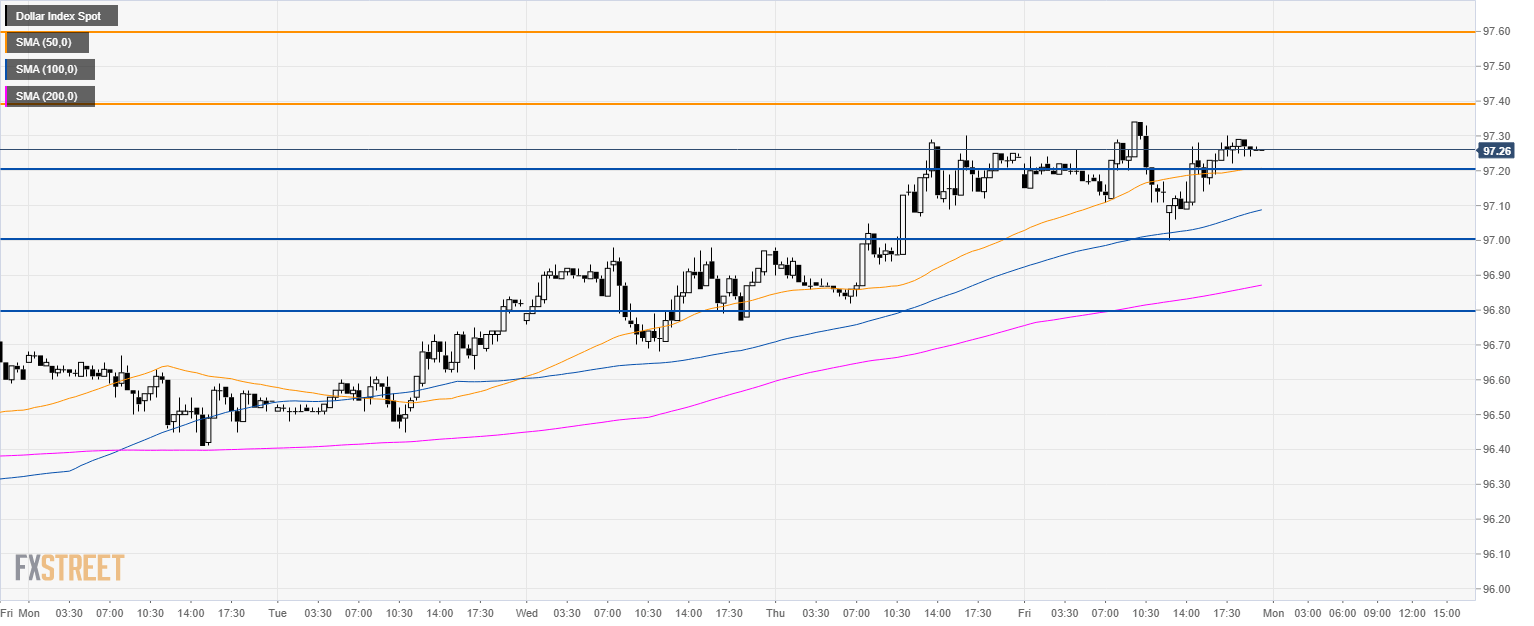
DXY 30-minute chart
- DXY is trading above its main SMAs suggesting a bullish bias in the short-term.
- The bull trend is intact and the market will have to break above 97.40 key resistance to extend gains towards the 96.60 level.
- Looking to the downside, support is at 97.20, 97.00 and 96.80 level.
Additional key levels