Wednesday 26th June: Dollar snaps four-day losing streak and forms daily bullish engulfing candle.

Key risk events today:
New Zealand Official Cash Rate and RBNZ Rate Statement; UK Inflation Report Hearings; US Core Durable Goods Orders m/m; US Durable Goods Orders m/m.
EUR/USD:
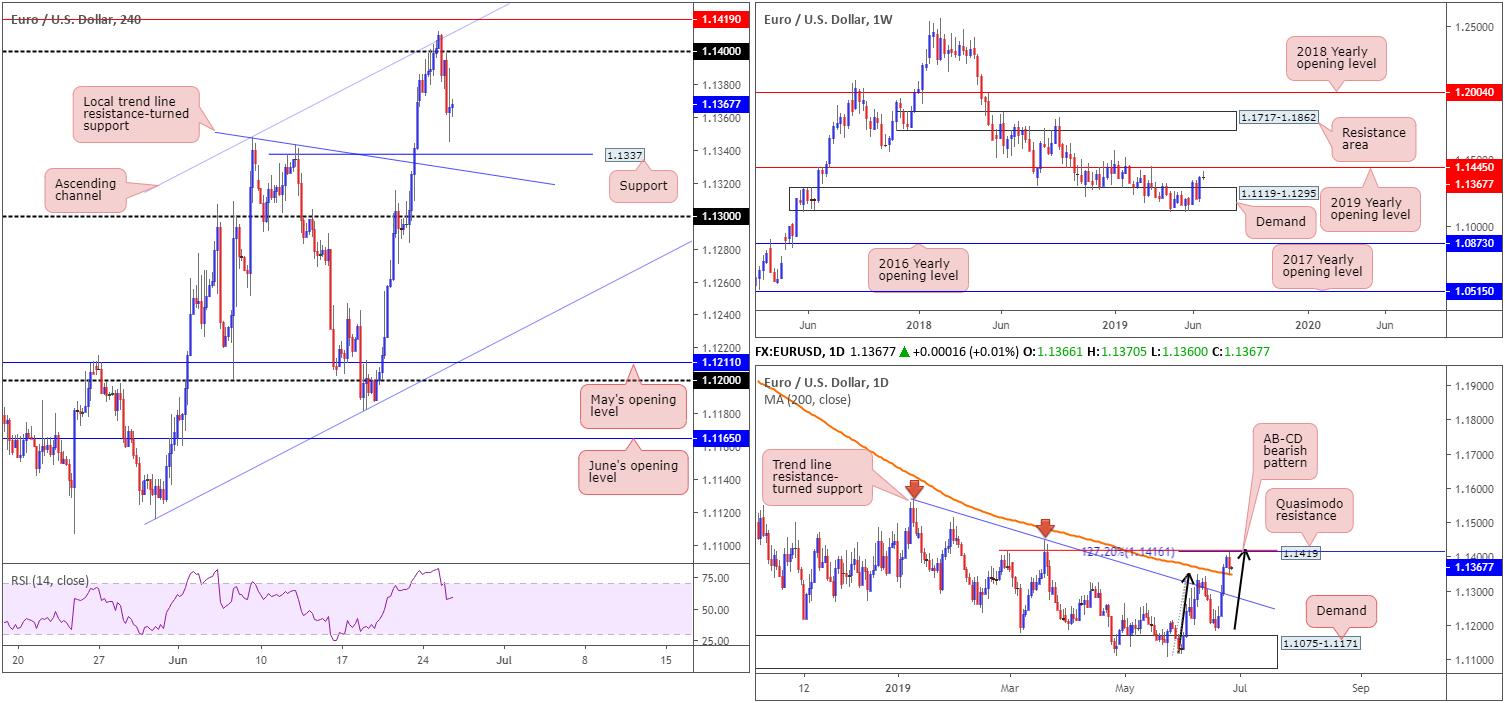
The shared currency concluded Tuesday’s session snapping a 4-day winning streak (supported by momentum flows after last week’s dovish FOMC), after shaking hands with a H4 channel resistance (extended from the high 1.1347) and reclaiming the 1.14 handle.
Fed commentary was not as dovish as traders were expecting, lifting the US dollar index higher and snapping four days of losses. The US consumer confidence data saw the headline fall by more than expected, though the inflation gauge was higher.
For folks who read Tuesday’s briefing you may recall the following:
Selling between 1.1445/1.14 (comprised of the weekly resistance level at 1.1445, the daily Quasimodo resistance at 1.1419 [as well as the 127.2% AB=CD – black arrows – bearish pattern at 1.1416] and the round number 1.14 [along with merging H4 channel resistance]) is an option.
As for entry and exit, stop-loss placement is best set beyond the sell zone at around 1.1447, with an initial target fixed at the 200-day SMA (currently trading at 1.1351).
As is evident from the charts this morning, price action, by way of a daily bearish engulfing formation, responded to the lower edge of the noted sell zone and struck the 200-day SMA. Well done to any of our readers who managed to jump aboard here. The next downside target beyond the aforesaid SMA is H4 support coming in at 1.1337 and local trend line resistance-turned support.
Areas of consideration:
With a reasonably well-stacked resistance area in play between 1.1445/1.14, along with a fresh daily bearish engulfing candle, entering long from the 200-day SMA is chancy. Further downside, at least until we reach the aforementioned H4 supports, is likely. Therefore, sellers out of 1.1445/1.14 may want to consider reducing risk to breakeven at this point, with the expectation of taking partial profits around 1.1337.
GBP/USD:
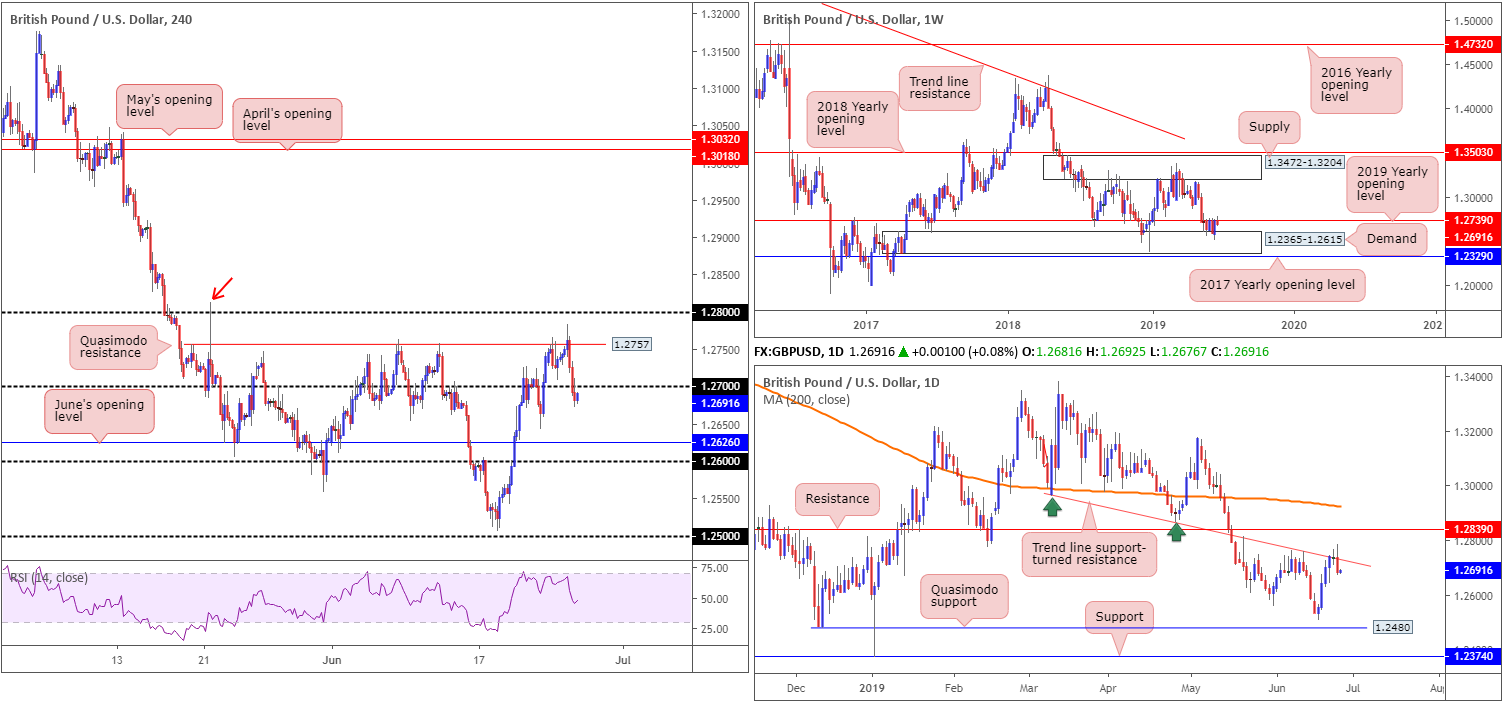
Weighed on by the US dollar index snapping a 4-day losing streak, as well as robust GBP/USD technical resistance, the British pound declined vs. its US counterpart Tuesday, down 0.45%.
For traders who read our previous reports you may recall the following:
Traders are encouraged to include the H4 Quasimodo resistance at 1.2757 in their analysis today/early week, due to its surrounding confluence (the daily trend line resistance and the 2019 yearly opening level on the weekly timeframe at 1.2739). However, traders should also prepare for the possibility of a fakeout through this level, as the market may want to bring in additional sellers from 1.28 positioned nearby.
As a result of the above, the area between 1.28 and 1.2757 is of interest for selling. Favoured stop-loss placement, according to our technical studies, is beyond the 1.2813 May 21 high (red arrow), with the initial downside target placed at 1.27.
In the shape of a daily bearish engulfing pattern, price action responded beautifully from the aforementioned sell zone and reclaimed the 1.27 handle to the downside on the H4 timeframe. Well done to any of our readers who took advantage of this move.
Going forward, the next support target can be seen at June’s opening level (H4) drawn from 1.2626, followed closely by the top edge of weekly demand at 1.2615.
Areas of consideration:
For folks short the GBP, reducing risk to breakeven and taking partial profits off the table might be an idea at this point. With a little help from 1.27 serving as resistance, the next take-profit target: June’s opening level at 1.2626 may enter the fold today.
AUD/USD:
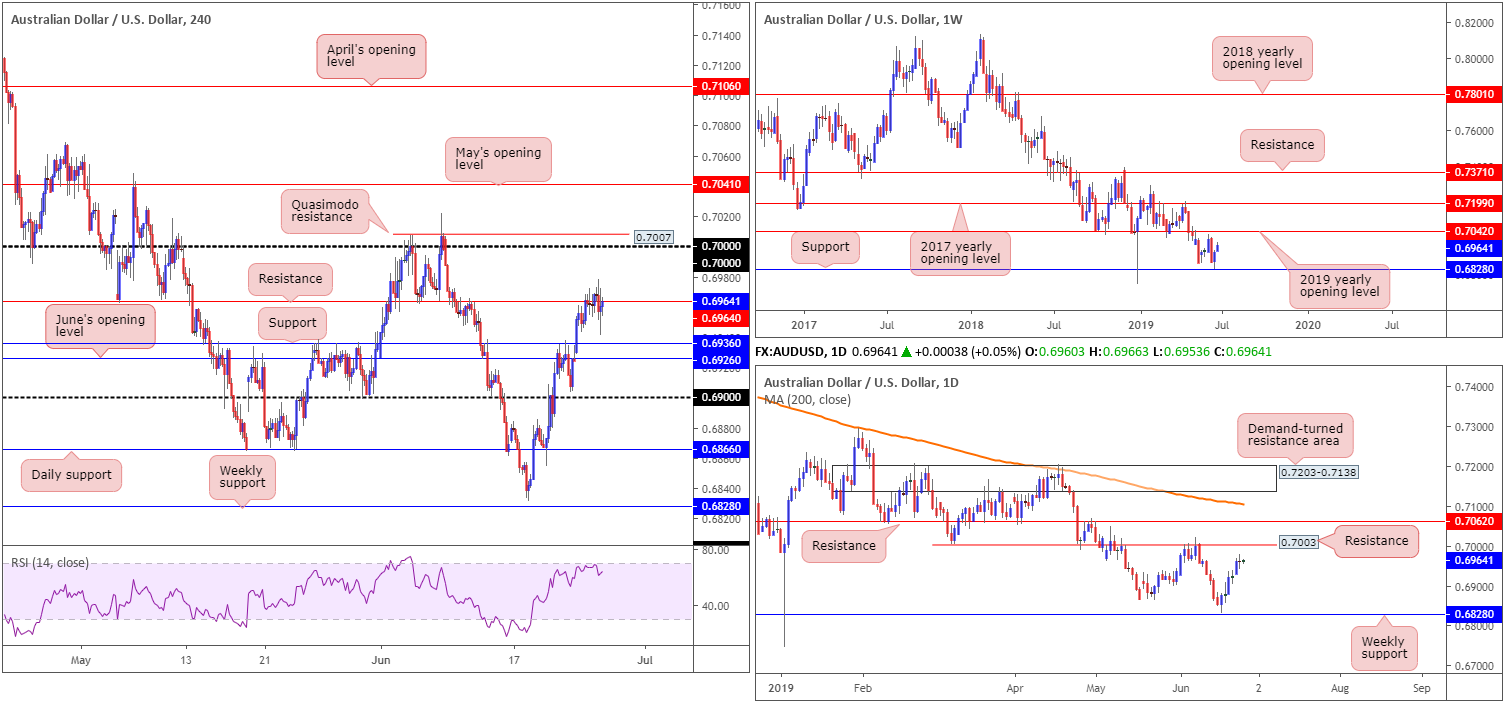
A broad-based USD recovery took shape Tuesday (US dollar index) – Fed commentary was not as dovish as traders were expecting – reclaiming Monday’s losses and snapping a 4-day losing streak. This weighed on the Australian dollar’s recent move higher, consequently flipping between gains/losses around H4 resistance at 0.6964. In terms of nearby structure to be aware of on the H4 timeframe, support can be seen nearby at 0.9636, trailed closely by June’s opening level at 0.6926. To the upside we also have the key figure 0.70 and closely merging Quasimodo resistance at 0.7007.
Weekly timeframe analysis taken from Monday’s weekly briefing:
Over the course of last week’s sessions, price action came within a couple of points of connecting with notable support pencilled in at 0.6828 (a level offering history as far back as mid-2003) before rotating higher. Adding more than 50 points, and likely sparking buyer interest, further upside could be on the cards this week, with an initial objective set at the 2019 yearly opening level 0.7042.
Shifting focus to the daily timeframe, we can see the unit finished Tuesday in the shape of an indecision candle, following a five-day bullish phase. Technically speaking, room to manoeuvre higher this week is still visible, targeting resistance plotted at 0.7003. Note this level held price action lower since early May.
Areas of consideration:
In light of Tuesday’s lacklustre performance, two scenarios remain on the menu:
- A H4 close above 0.6964, followed up with a retest, offers short-term traders the chance to buy this market, ultimately targeting 0.70 (entry and risk can be structured according to the rejection candle’s parameters).
- A sell from 0.70, knowing we have the following confluence: a H4 Quasimodo resistance level at 0.7007 and a daily resistance at 0.7003. Although the threat of further upside beyond 0.70 is present on the weekly timeframe to 0.7042, a short from 0.70 remains valid. Those concerned by weekly structure, however, could opt to wait for additional confirmation before pulling the trigger, formed by way of a H4 or H1 bearish candlestick signal. Not only does the bearish candlestick signal identify seller intent, it also helps traders locate entry and risk levels to work with.
USD/JPY:
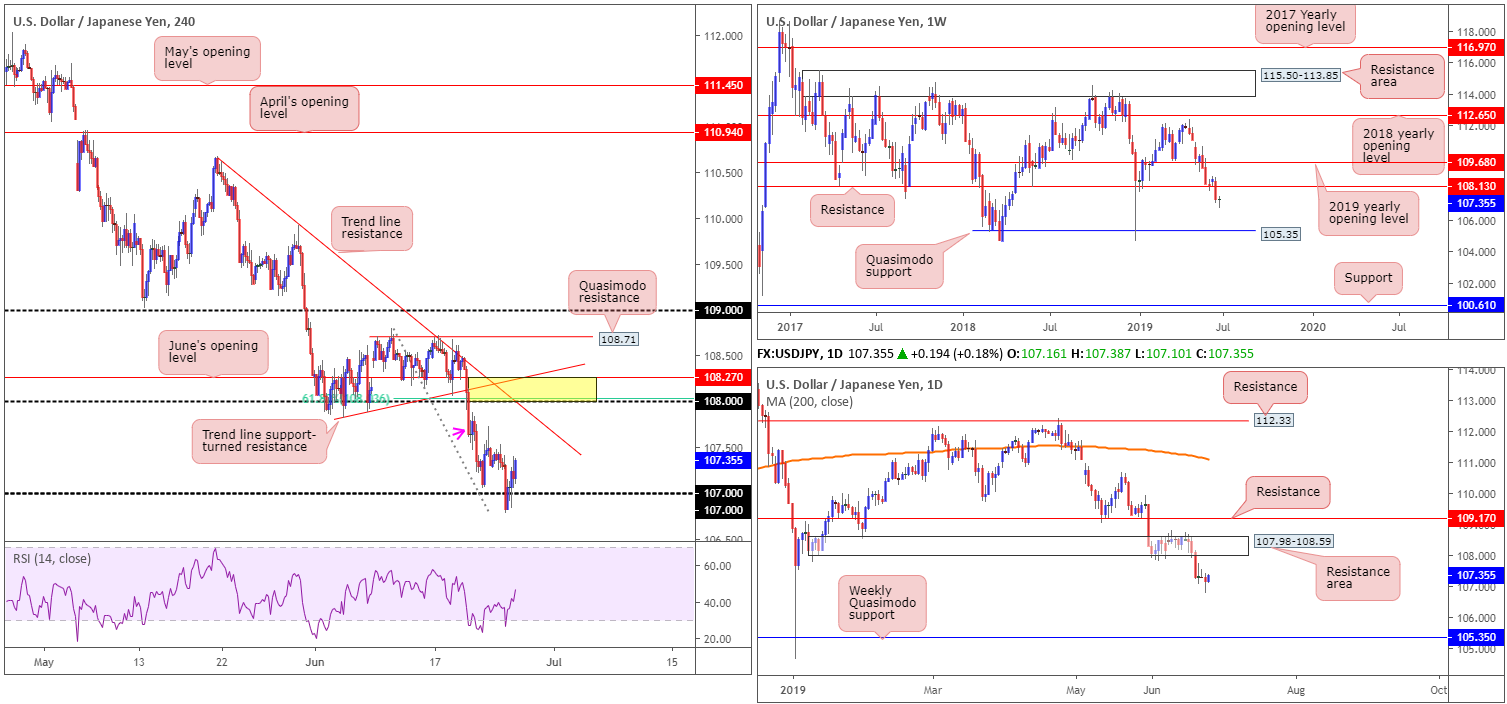
The USD/JPY encountered renewed selling pressure amid early US trade Tuesday, slipping below the 107 handle. Fed commentary, however, was not as dovish as traders were expecting, consequently lifting the US dollar index higher and the USD/JPY along with it, settling at 107.16 into the close.
Continued buying from here faces a number of obstacles. The first being a H4 supply marked with a pink arrow at around 107.66ish. The second falls in at H4 trend line resistance (extended from the high 110.67) and the third, and more significant, is a H4 resistance area marked in yellow at 108.27/108 (comprised of June’s opening level at 108.27, a 61.8% Fibonacci resistance at 108.03, round number 108 and an intersecting trend line support-turned resistance (taken from the low 107.81). What’s also interesting is the underside of a daily resistance area at 107.98-108.59 provides higher-timeframe confluence at the 108.27/108 H4 zone, as does weekly resistance at 108.13.
Areas of consideration:
Having seen limited higher-timeframe support bolster the recent move higher, as well as a collection of H4 resistances present overhead, entering long in this market is a chancy move, according to our technical reading.
Although we may observe a rotation lower before reaching the H4 resistance area highlighted above at 108.27/108, this area has ‘sell me’ written all over it, given its confluence. Therefore, the main focus today will be at this zone for possible shorting opportunities. Stop-loss orders can be tucked above 108.27 by a couple of pips with entry coming in at 108.
USD/CAD:
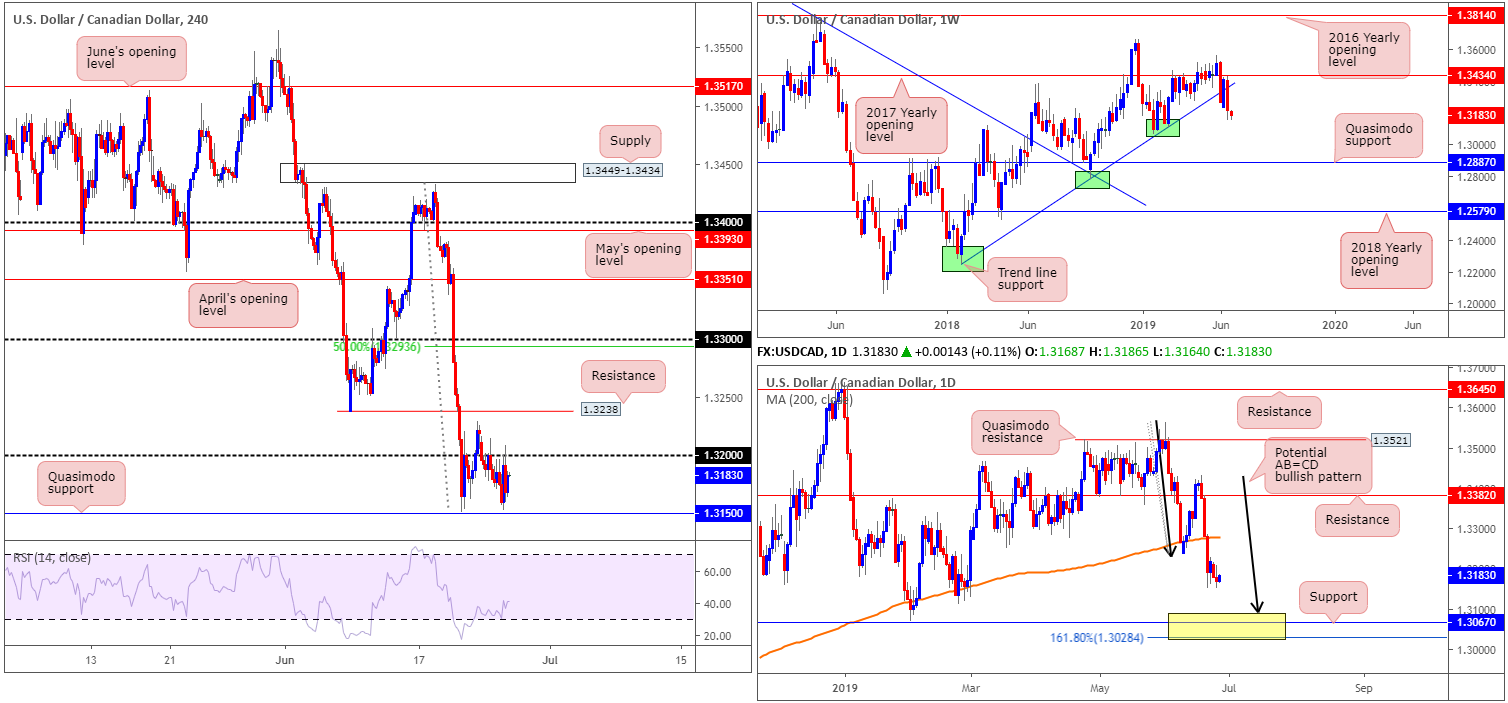
With upside attempts being limited by the 1.32 handle, Tuesday’s session concluded in negative territory for a second consecutive day, down 0.08%. Quasimodo support at 1.3150 remains firmly in focus as the next downside target on the H4 timeframe.
Higher-timeframe analysis, on the other hand, is interesting and sports a downside tone at the moment. Here’s what our previous reports had to say:
From the weekly timeframe, we can see that since coming within two points of the 2017 yearly opening level at 1.3434 (resistance), the pair reclaimed trend line support (extended from the low 1.2247) in strong fashion last week. Limited demand is visible to the left of current price, therefore the possibility of further downside this week is in store, targeting Quasimodo support at 1.2887.
A closer reading of price action on the daily timeframe recently observed a decisive close beneath the 200-day SMA and opened the door for a possible run to a support area fixed between 1.3028/1.3089 (yellow). Comprised of an AB=CD (black arrows) formation at 1.3089, a support at 1.3067 and a 161.8% Fibonacci extension at 1.3028 (forms part of the AB=CD structure), this area likely has enough confluence to hold price should we reach this far south this week.
Areas of consideration:
In view of Tuesday’s limited movement, the research team’s outlook remains unchanged:
With a clear downside tone emphasised on the higher timeframes, at least until reaching the daily support area mentioned above at 1.3028/1.3089, selling this market could be an option worth exploring. Selling at current price remains chancy, however, since active buyers may reside around the H4 Quasimodo support at 1.3150. Once (if) this level is cleared, though, a sell is high probability to the top edge of the aforementioned daily support area at 1.3089.
A break of 1.3150 could be sold on the back of the breakout candle’s structure, or alternatively traders may wish to wait and see if a retest of 1.3150 develops. Traders can then consider entering on the back of the rejection candle’s structure.
USD/CHF:
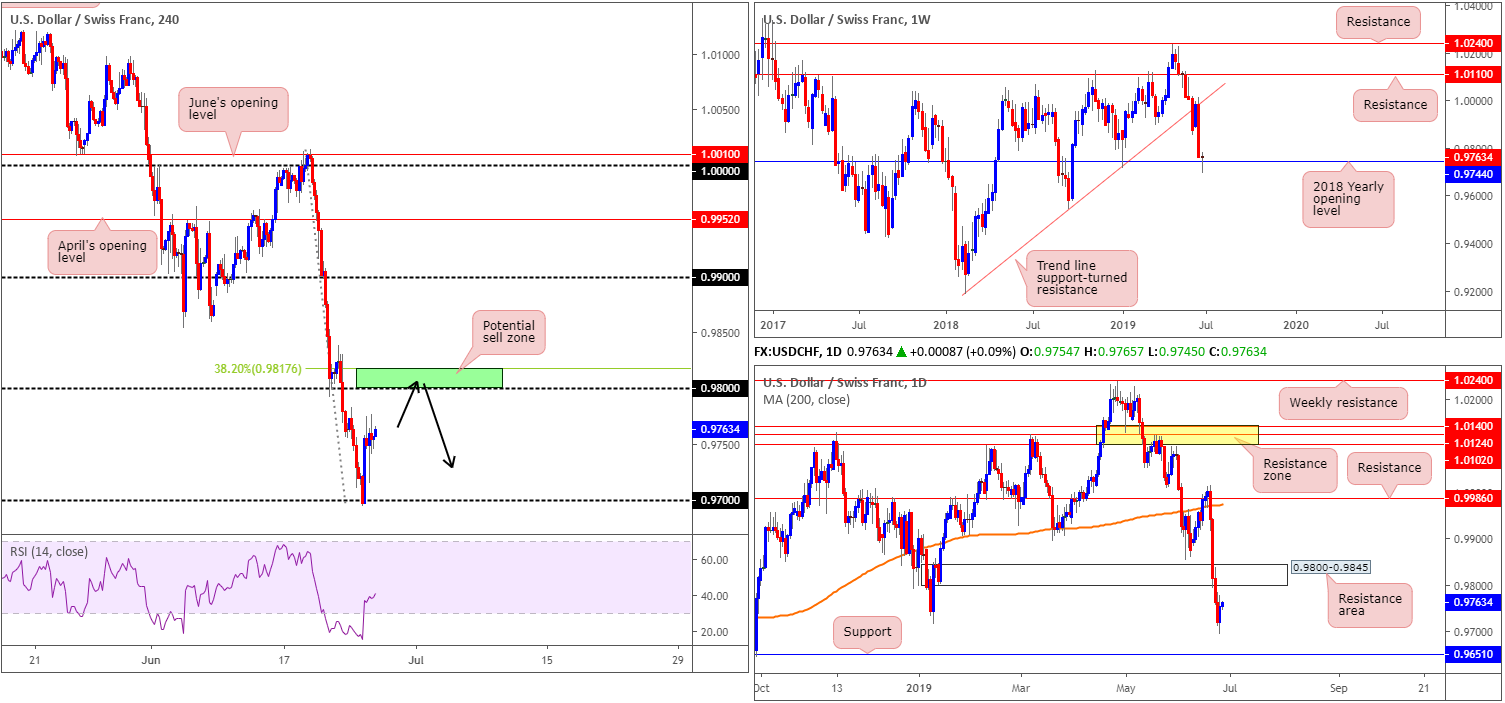
Aided by a broad-based USD recovery as well as some help likely emerging from USD/CHF’s 2018 yearly opening level on the weekly timeframe (support) at 0.9744, Tuesday witnessed the USD/CHF test 0.97 beautifully and hold ground. Recent buying, as you can see, positioned the H4 candles within striking distance of the 0.98 handle, which is a significant resistance.
The research team favour 0.98 as a potential sell zone due to its convergence with the underside of a daily demand-turned resistance area at 0.9800-0.9845. In addition to this, traders may also want to note a 38.2% H4 Fibonacci resistance resides close by at 0.9817.
Areas of consideration:
Although a short from 0.9817/0.98 (green zone on the H4 timeframe) is appealing, given the convergence of daily structure, weekly support has re-entered the fight at 0.9744. Does this mean a sell from 0.9817/0.98 is invalid? Definitely not. All it means is traders concerned by the threat of further upside materialising on the weekly timeframe may opt to wait and see how H4 action behaves once the noted sell zone enters the mix. A H4 bearish candlestick signal – think shooting star of engulfing formation – for example, not only identifies seller intent at an area of interest, it also provides entry and risk levels to trade with. Therefore, a short, in this case, would be high probability, potentially targeting 0.97.
Dow Jones Industrial Average:
Wall Street’s main benchmarks slipped lower Tuesday amid trade concerns and rising tensions in the Middle East. In addition, investors focused on speeches by Federal Reserve officials for clues on monetary policy – Fed commentary was not as dovish as traders were expecting. The Dow Jones Industrial Average slipped 0.67%; the S&P 500 also declined 0.95% and the tech-heavy Nasdaq dropped 1.70%.
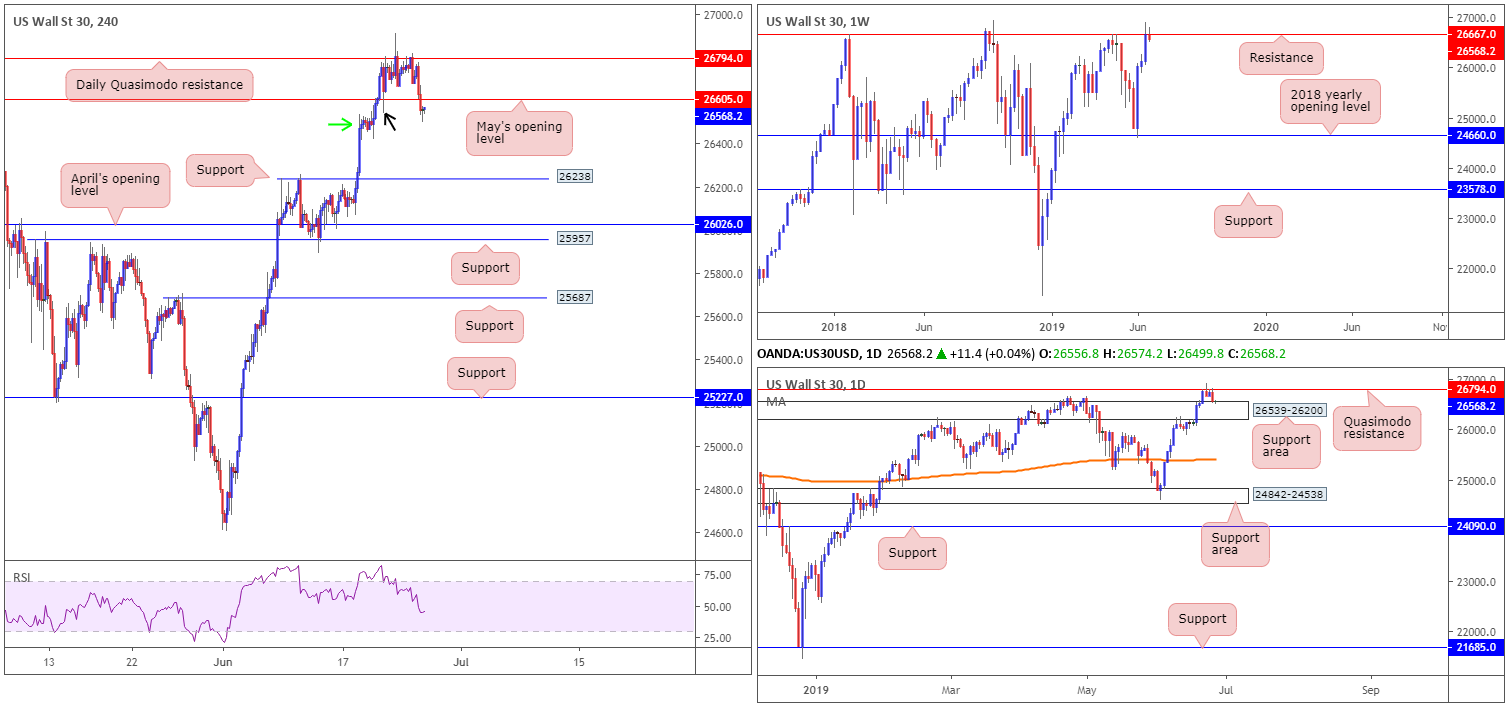
From a technical perspective, the DJIA is, thanks to recent selling, seen trading back beneath weekly resistance at 26667.Limited support is visible, therefore further selling on this timeframe could develop. Daily Quasimodo resistance at 26794 also held ground, perhaps influenced by Friday’s shooting star pattern. Yesterday’s decline brought the unit to a nearby support area coming in at 26539-26200, which could hamper further downside.
A closer reading of price action on the H4 timeframe has the candles trading sub May’s opening level at 26605. According to our technical studies, this may have unlocked downside to as far south as support drawn from 26238. The H4 demand to the left of current price (green arrow) is likely already partially consumed by the tail at 26539 (black arrow).
Areas of consideration:
Despite recent selling, this is still a difficult market to trade. Irrespective of the direction one selects, opposing structure is clearly evident. For example, a sell based on the move back beneath weekly resistance and H4 price reclaiming May’s opening level at 26605 faces possible buying not only from the daily support area at 26539-26200, but also due to the fact we’re entrenched within a reasonably strong uptrend at present.
Therefore, unless you’re comfortable trading against a potential opposing force, opting to remain on the sidelines until clearer price action is visible is still worth considering.
XAU/USD (GOLD):
Safe-haven demand diminished in recent hours, with the Japanese yen, Swiss Franc and bullion all pressing lower. In recent news, Fed commentary was not as dovish as traders were expecting, along with the US dollar snapping a 4-day losing streak.
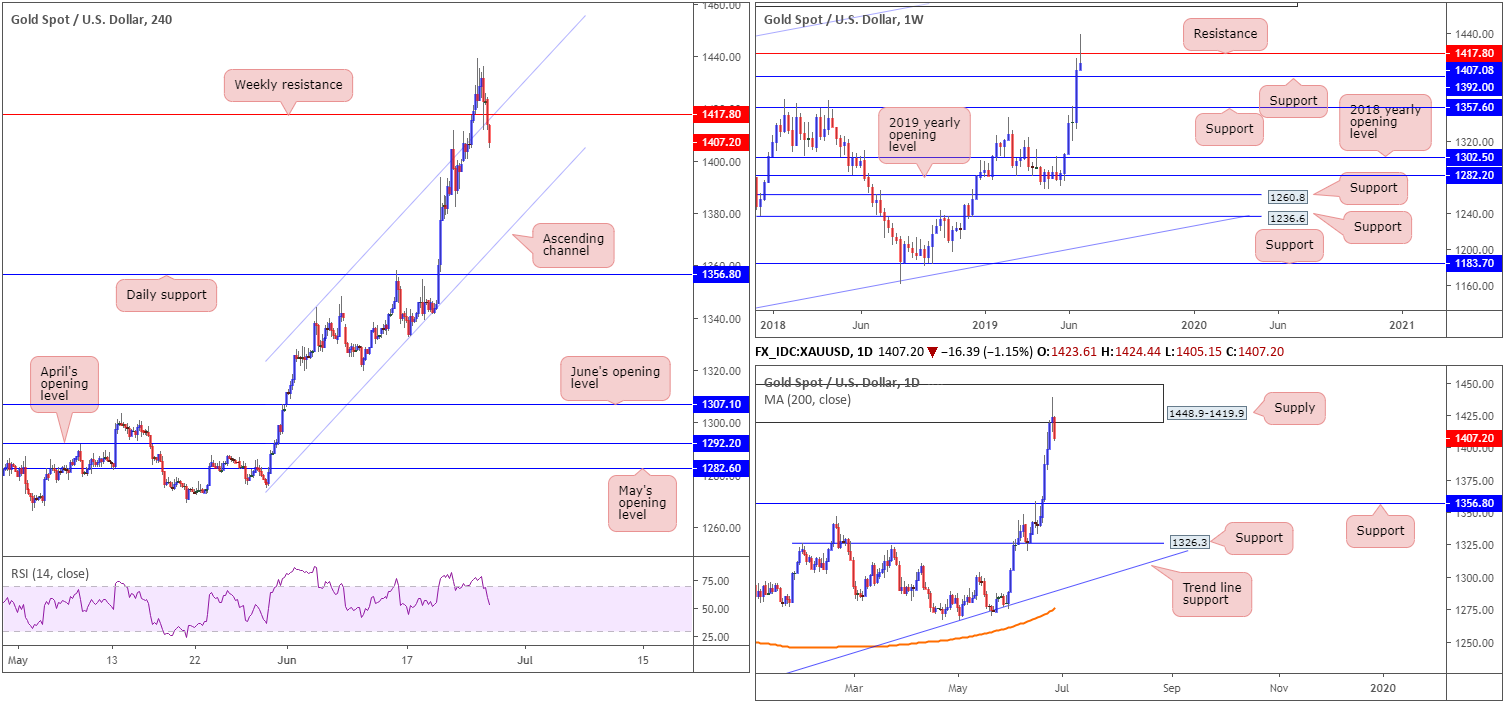
Weekly resistance at 1417.8, despite a recent move to highs at 1439.1, is seen holding ground, with the next downside hurdle set at weekly support drawn from 1392.0. The said weekly resistance also boasts a reasonably strong buffer zone on the daily timeframe by way of a supply at 1448.9-1419.9. Drawn from mid-2013, and holding price lower on two occasions since then, active sellers clearly inhabit this region, with a downside target set at support fixed from 1356.8.
On the H4 timeframe, traders can see the candles re-entered an ascending channel formation in recent hours, perhaps leading to follow-through selling towards channel support taken from the low 1274.8. Before reaching this far south, though, a break of the weekly support at 1392.0 would need to be seen.
Areas of consideration:
According to the above reading, further selling could be in store today. With that being the case, a retest at weekly resistance mentioned above at 1417.8 may be of interest to some traders today, targeting weekly support at 1392.0. Given the strong uptrend the yellow metal is in right now, however, it may be an idea to consider waiting for additional H4 candlestick confirmation to form before pulling the sell trigger (entry/risk levels can be determined according to the candlestick’s arrangement).
The accuracy, completeness and timeliness of the information contained on this site cannot be guaranteed. IC Markets does not warranty, guarantee or make any representations, or assume any liability with regard to financial results based on the use of the information in the site.
News, views, opinions, recommendations and other information obtained from sources outside of www.icmarkets.com.au, used in this site are believed to be reliable, but we cannot guarantee their accuracy or completeness. All such information is subject to change at any time without notice. IC Markets assumes no responsibility for the content of any linked site. The fact that such links may exist does not indicate approval or endorsement of any material contained on any linked site.
IC Markets is not liable for any harm caused by the transmission, through accessing the services or information on this site, of a computer virus, or other computer code or programming device that might be used to access, delete, damage, disable, disrupt or otherwise impede in any manner, the operation of the site or of any user’s software, hardware, data or property.