Thursday 12th September: Euro tests 1.10 ahead of ECB policy decisions and President Draghi’s press conference.

Key risk events today:
Europe Main Refinancing Rate and Monetary Policy Statement; ECB Press Conference; US CPI m/m and Core CPI m/m.
EUR/USD:
Firmer-than-forecast US PPI contributed to the buck’s advance Wednesday, though the dollar index largely broke higher on the back of pronounced euro weakness ahead of today’s ECB policy decisions and President Draghi’s press conference.
The producer price Index for final demand rose 0.1% in August, seasonally adjusted, the US Bureau of Labour Statistics reported yesterday. Final demand prices moved up 0.2% in July and 0.1% in June. The index for final demand less foods, energy, and trade services rose 0.4% in August following a -0.1% decline in July.
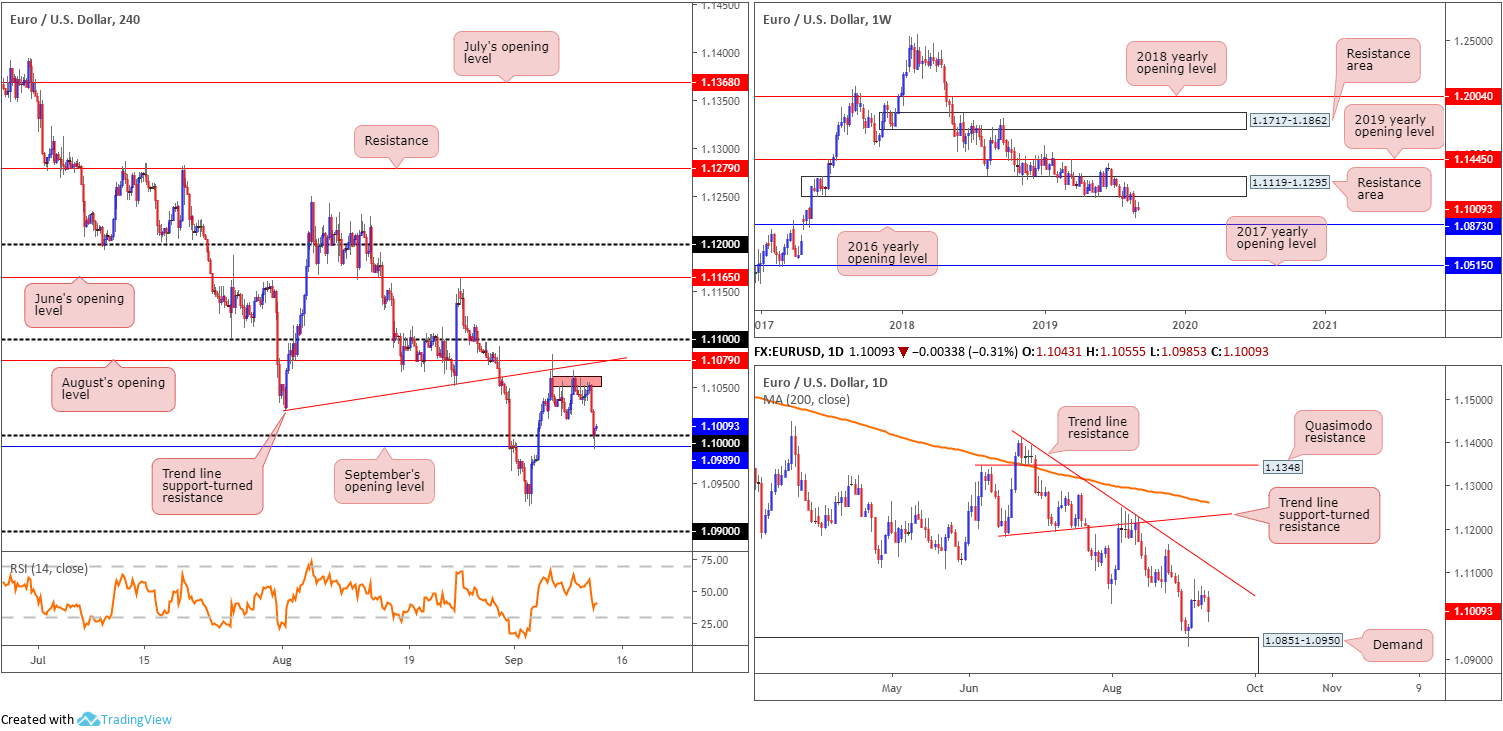
EUR/USD technicals have the H4 candles shaking hands with key figure 1.10 into the close, despite a whipsaw to September’s opening level nearby at 1.0989. The move likely tripped sell stops, both from traders attempting to long 1.10 and also breakout sellers. An advance from current price has tops around the 1.1050 region to target (red area), closely shadowed by August’s opening level at 1.1079, trend line support-turned resistance (taken from the low 1.1028) and the 1.11 handle. A rotation south, on the other hand, has last Tuesday’s low at 1.0926 in sight, followed by 1.09.
Higher-timeframe analysis shows weekly price to be languishing south of 1.1119-1.1295, a demand-turned resistance area. Current action is still leaning towards a retest of the zone, though a run to the 2016 yearly opening level at 1.0873 is also a possibility. Elsewhere, daily flow remains buoyed by demand pencilled in at 1.0851-1.0950 – houses the 2016 yearly opening level within its lower limits. Trend line resistance taken from the high 1.1412 remains the initial port of call for upside targets on this scale.
Areas of consideration:
Ahead of today’s ECB policy decisions and President Draghi’s press conference, price action will likely consolidate around 1.10. Technically, the weekly timeframe points to lower prices, at least until reaching 1.0873, though faces support from the upper base of demand on the daily timeframe at 1.0851-1.0950 before reaching 1.0873.
H4 resistances to be aware of for potential selling, should we press higher following ECB movement, are August’s opening level at 1.1079 and its intersecting trend line resistance, the 1.11 handle and the closely converging daily trend line resistance and June’s opening level at 1.1165.
In the event we turn lower, however, watch for 1.10 to be taken followed up by a retest for possible selling opportunities, targeting the top edge of daily demand at 1.0950 as the initial target.
GBP/USD:
Sterling concluded a shade lower vs. the buck Wednesday, largely weighed by a robust dollar index on the back of pronounced euro weakness ahead of today’s ECB policy decisions.
Despite the recent descent, technical structure remains unaltered according to our chart studies. As a result, much of the following report will echo thoughts aired in Wednesday’s briefing.
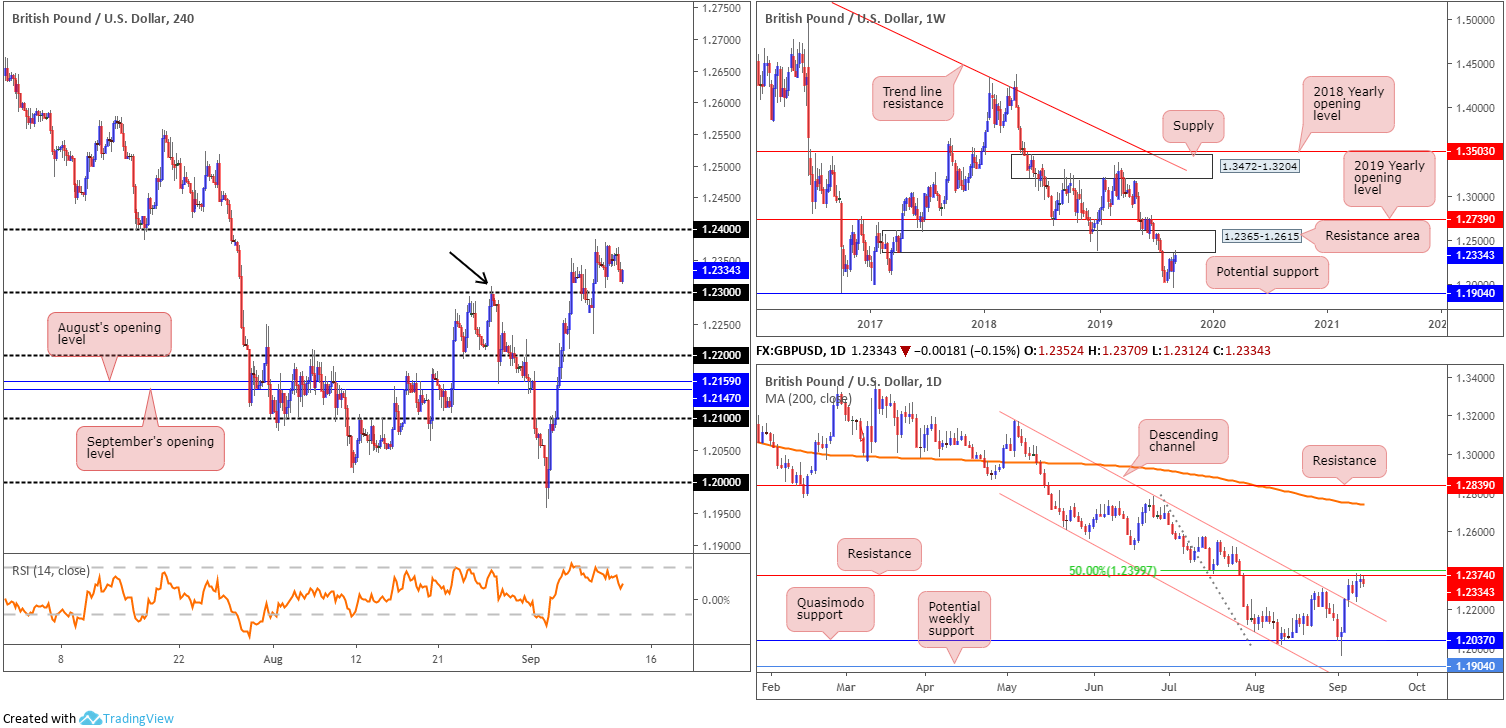
From a technical perspective, having seen the notable high set at 1.2309 (black arrow) recently engulfed on the H4 scale, traders, particularly on the H4 timeframe and lower, are likely eyeing higher movement. However, this comes at a price. Higher-timeframe analysis has a weekly resistance area positioned at 1.2365-1.2615 in motion, and daily price tackling resistance at 1.2374, closely shadowed by the 50.0% resistance value at 1.2399.
Areas of consideration:
Considering the technical position on the higher timeframes, sellers likely have the upper hand. Before pressing the sell button, though, traders are urged to let H4 price prove itself: reclaiming 1.23 to the downside which should clear the pathway south to at least 1.22. A H4 close below 1.23 that’s followed up by a retest is considered an ideal sell signal (entry and risk can be determined on the back of the rejection candle’s framework).
AUD/USD:
The Westpac-Melbourne Institute Index of Consumer Sentiment declined by 1.7% to 98.2 in September from 100 in August, according to Westpac Banking Corporation yesterday. Following the release, AUD/USD movement turned lower and came within touching distance of connecting with August’s opening level at 0.6848 on the H4 timeframe.
Thanks to a somewhat lacklustre close, technical structure remains unchanged and, therefore, the following will offer a similar outlook put forward in Wednesday’s briefing.
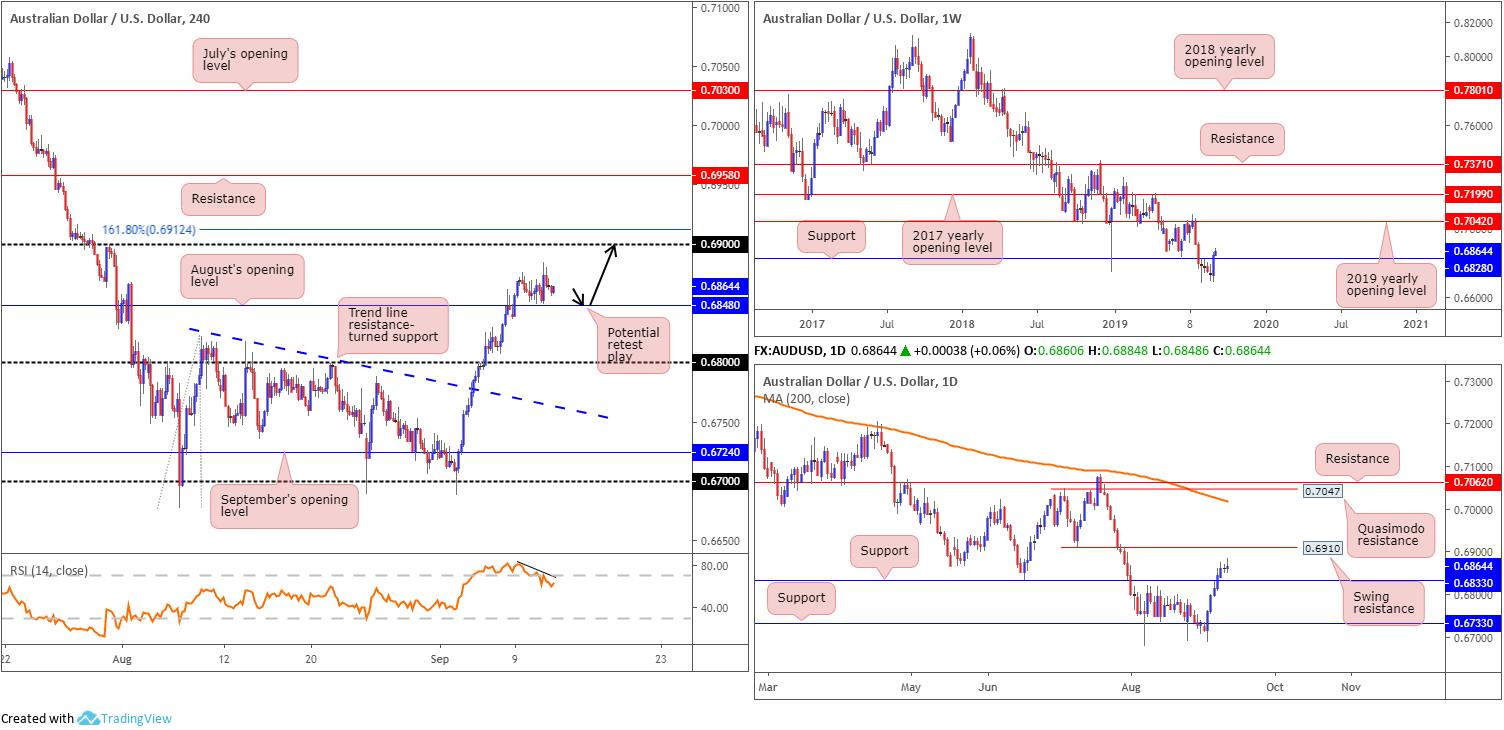
Kicking things off on the weekly timeframe, we can see the pair staged a strong comeback last week. By way of a bullish outside day, the unit wrapped up the week north of support at 0.6828. If buyers remain in the driving seat, an approach towards the 2019 yearly opening level at 0.7042 is likely on the cards.
In conjunction with weekly structure, the daily timeframe also ended last week north of support at 0.6833. The next upside target on this scale, nonetheless, falls in at 0.6910, a swing resistance, though beyond here the research team has eyes on Quasimodo resistance at 0.7047 and resistance at 0.7062. It might also interest some traders to note the 200-day SMA also lurks close by at 0.7023 (orange).
Across the page, H4 movement is set just north of August’s opening level at 0.6848, with upside reasonably clear to 0.69, closely followed by a 161.8% Fibonacci ext. point at 0.6912. Indicator-based traders, however, may wish to acknowledge the RSI is exiting overbought terrain and producing mild negative divergence.
Areas of consideration:
Considering the increasingly strong bullish theme on the higher timeframes, entering long based on a retest at August’s opening level drawn from 0.6848 on the H4, is still the favoured option. A retest of this level in the shape of a H4 bullish candlestick signal will likely entice buyers into the market, with eyeballs on 0.69 as the initial upside target, set just beneath daily resistance at 0.6910 and the 161.8% H4 Fibonacci ext. point mentioned above at 0.6912.
Should this trade eventually come to fruition, traders are also urged to take into account yesterday’s high at 0.6884 which could house active sellers.
USD/JPY:
In recent news, China announced that some US products will be exempted from additional 25% tariffs. The update appears to be a trade concession ahead of October talks, though the items are mostly lubricants and fodder. Nevertheless, major European equity indexes gained in response to the announcement, consequently strengthening risk appetite and diminishing demand for the safe-haven Japanese yen.
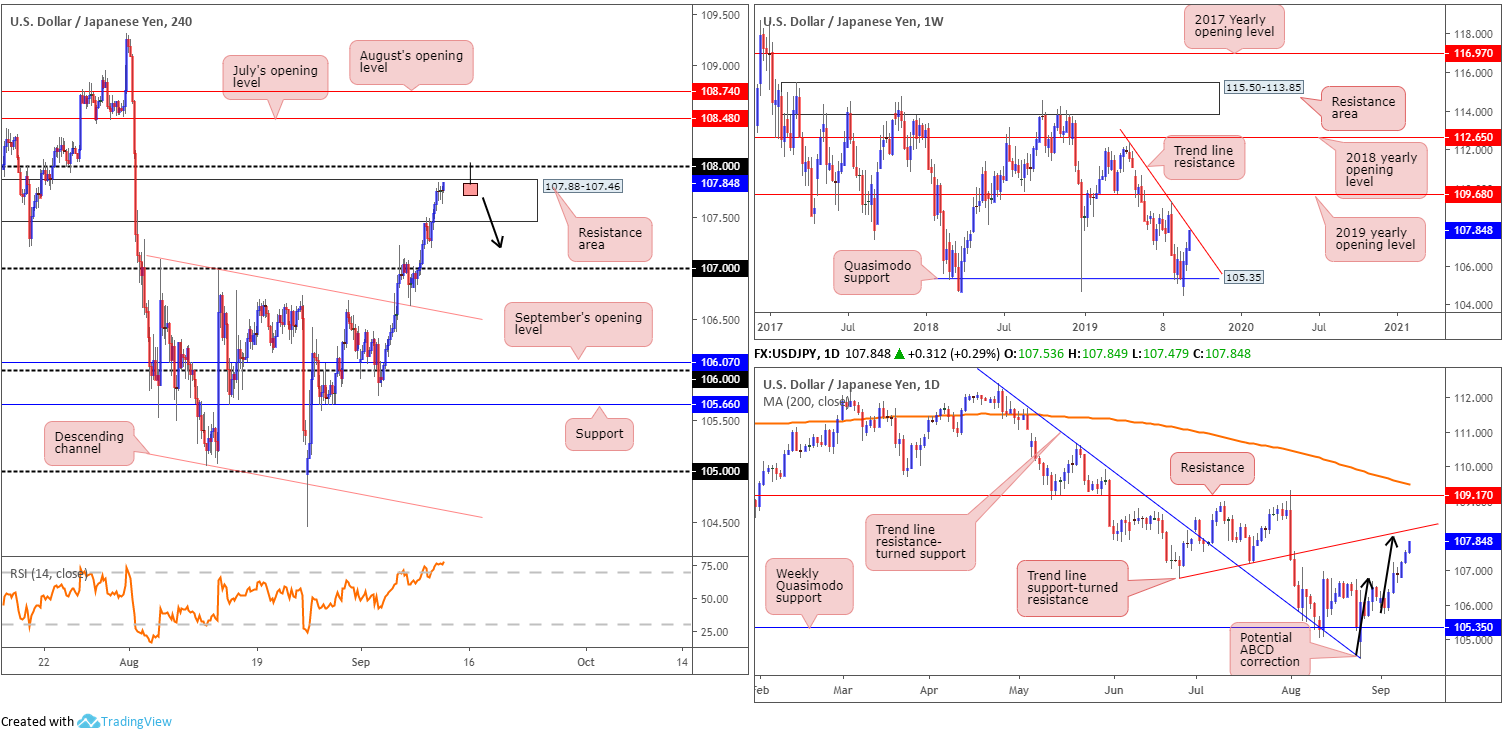
USD/JPY bidding observed the H4 candles ascend higher within the walls of a resistance area coming in at 107.88-107.46.
For those who read Wednesday’s briefing you may recall the following:
107.88-107.46 boasts a reasonably strong standing, therefore a response from within its parapets is still possible. Directly overhead, traders may also wish to acknowledge possible resistance emerging from 108. It may also interest some traders to note the RSI indicator is seen testing overbought territory.
In terms of where we stand on the weekly timeframe, Quasimodo support at 105.35 held form and has positioned the current weekly candle within shouting distance of trend line resistance (extended from the high 112.40). Note this trend line also happens to intersect with the upper boundary of the H4 resistance area highlighted above at 107.88-107.46.
Looking at the daily timeframe, the technical picture emphasises further upside may be in store, targeting trend line support-turned resistance (extended from the low 106.78) in the shape of a potential ABCD correction terminating at 108.
Areas of consideration:
Outlook unchanged.
Although a response is possible from the H4 resistance area at 107.88-107.46, a fakeout through this area to orders sitting at 108 is also a strong possibility. Also remember the current weekly trend line resistance intersects with the UPPER limit of the H4 resistance zone and the daily candles are on course to complete an ABCD correction at 108.
Based on the chart studies, everything points to a move towards 108ish before sellers step in. An ideal bearish theme would be for H4 price to chalk up a bearish candlestick configuration that pierces through the upper edge of the current H4 resistance area, tripping a portion of buy stops, and tagging in sellers from 108 (see chart for a visual representation of a shooting star pattern). Selling on the back of the candlestick signal is certainly an option, with 107 set as a reasonable possibility regarding downside targets.
USD/CAD:
Snapping a three-day losing streak, the US dollar switched higher against its Canadian counterpart Wednesday, taking cues from broad-based USD strength, partly influenced by firmer-than-forecast US PPI, and waning WTI prices. Canada’s capacity utilisation data did come in better than expected, though did little to provide any strength to the loonie.
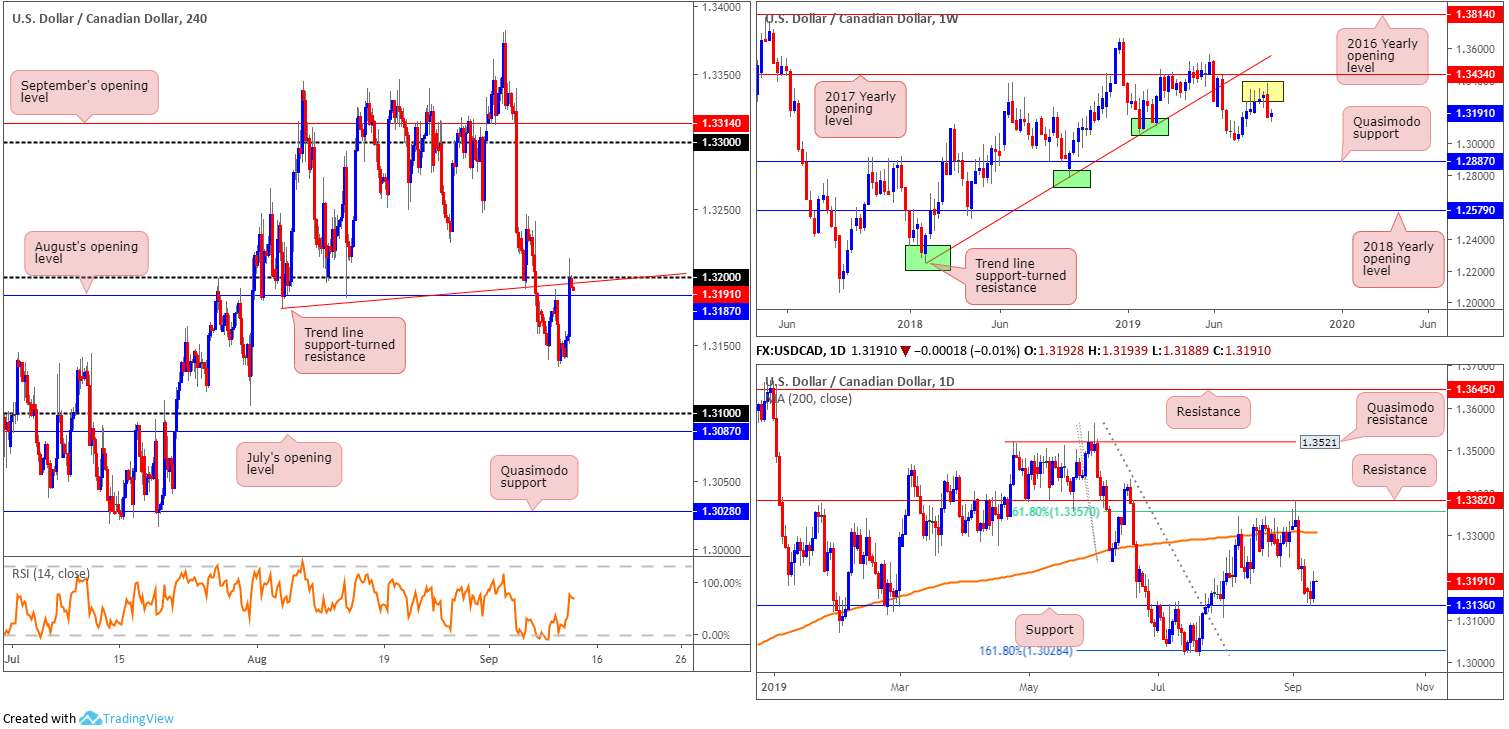
Wednesday’s technical briefing had the research team highlighting daily support at 1.3136 after price retested the underside of August’s opening level at 1.3187 on the H4 timeframe. Recent bidding, however, took the candles beyond 1.3187 to 1.32 which happens to merge closely with a trend line support-turned resistance extended from the low 1.3177.
Although selling 1.32 faces support off the daily timeframe at 1.3136, weekly flow suggests additional selling could still be in store.
Extracted from Wednesday’s briefing:
Leaving the 2017 yearly opening level at 1.3434 unchallenged on the weekly timeframe, last week’s movement wrapped up the week deeply within bearish territory. Down more than 1.00% and forming a clear-cut bearish outside day, traders’ focus will likely be on the 1.3016 July 15 low, followed by Quasimodo support at 1.2887.
Areas of consideration:
To confirm seller intent off 1.32, waiting for a H4 close to form beneath August’s opening level at 1.3187 (preferably followed up with a retest in the shape of a bearish candlestick configuration) is an option before pulling the trigger. This clears the path south back to daily support mentioned above at 1.3136.
A push above 1.32 today, nevertheless, signals longs could be the order of the day, placing 1.33 back on the radar. Note 1.33 also converges with the 200-day SMA (orange).
USD/CHF:
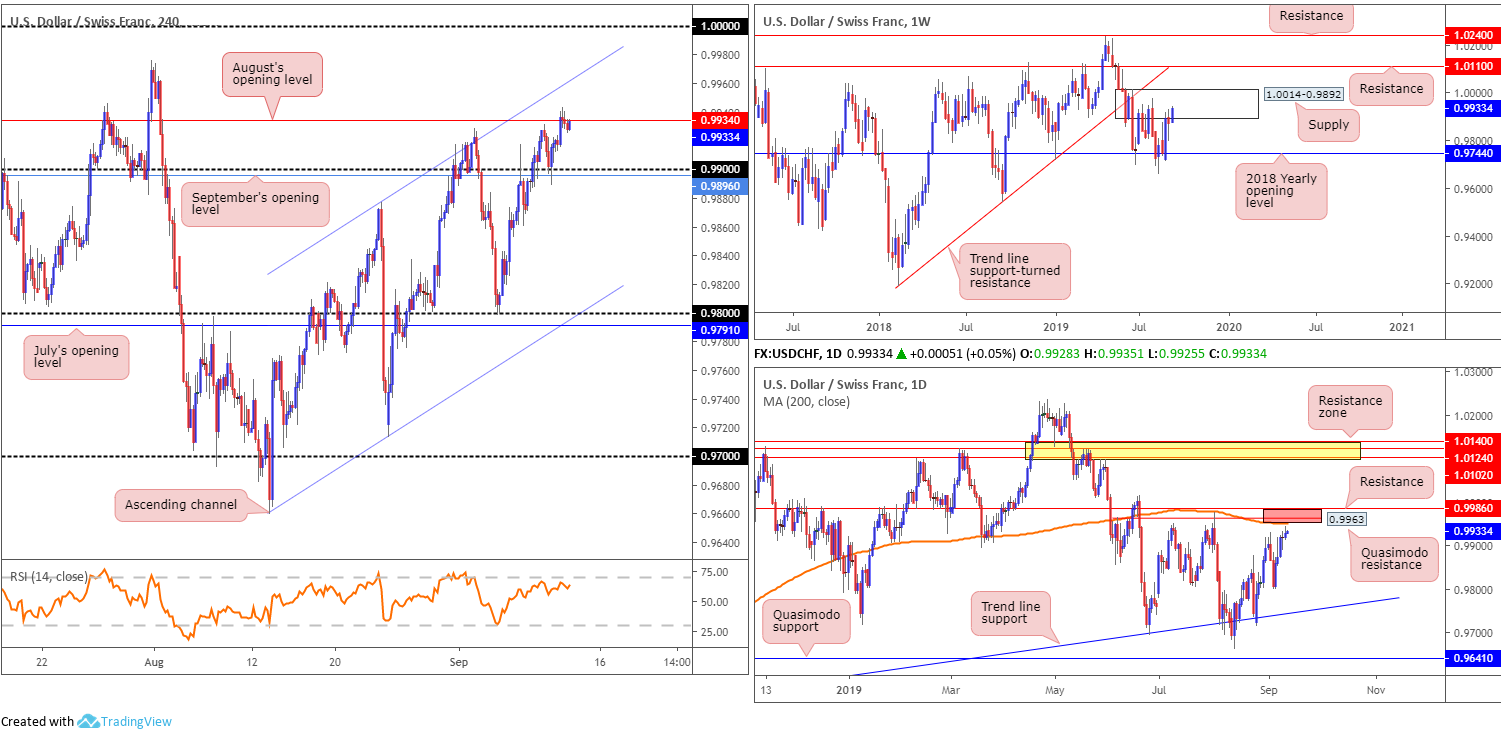
Broad-based USD bidding lifted the USD/CHF market to higher ground Wednesday, challenging levels not seen since the beginning of August.
August’s opening level at 0.9934 plotted on the H4 timeframe entered the fray and withstood numerous upside attempts. Beyond this point, the research team has their crosshairs fixed on channel resistance extended from the high 0.9877, whereas continued rejection off 0.9934 could lead to a revisit of 0.99/September’s opening level at 0.9896.
On more of a broader perspective, daily structure trades within close proximity to an interesting area of resistance. Between Quasimodo resistance at 0.9963, a 200-day SMA (orange – 0.9953) and resistance coming in from 0.9986 (red), this zone is likely to hold price action lower. Coupled with 0.9986/0.9953 on the daily scale, weekly activity has the current candle climbing into familiar supply coming in at 1.0014-0.9892. In the event buyers brush aside the said supply (unlikely a straightforward feat), resistance at 1.0110 is in view, as is a long-term trend line support-turned resistance taken from the low 0.9187.
Areas of consideration:
With weekly players trading from supply at 1.0014-0.9892, the research team has eyes on the daily resistance area between 0.9986/0.9953 for possible shorting opportunities. An ideal entry point would be the H4 channel resistance highlighted above, as this line intersects with the said daily zone. A test of the H4 channel area in the shape of a H4 bearish candlestick signal (entry and risk to be set according to this structure) is considered a high-probability setup with the likelihood of a sizeable move occurring from its formation.
Dow Jones Industrial Average:
The Dow Jones Industrial Average notched its sixth consecutive session of gains Wednesday, boosted by a rally among tech shares. The Dow added 227.61 points, or 0.85%; the S&P 500 added 21.52 points, or 0.72% and the tech-heavy Nasdaq 100 advanced 72.84 points, or 0.93%.
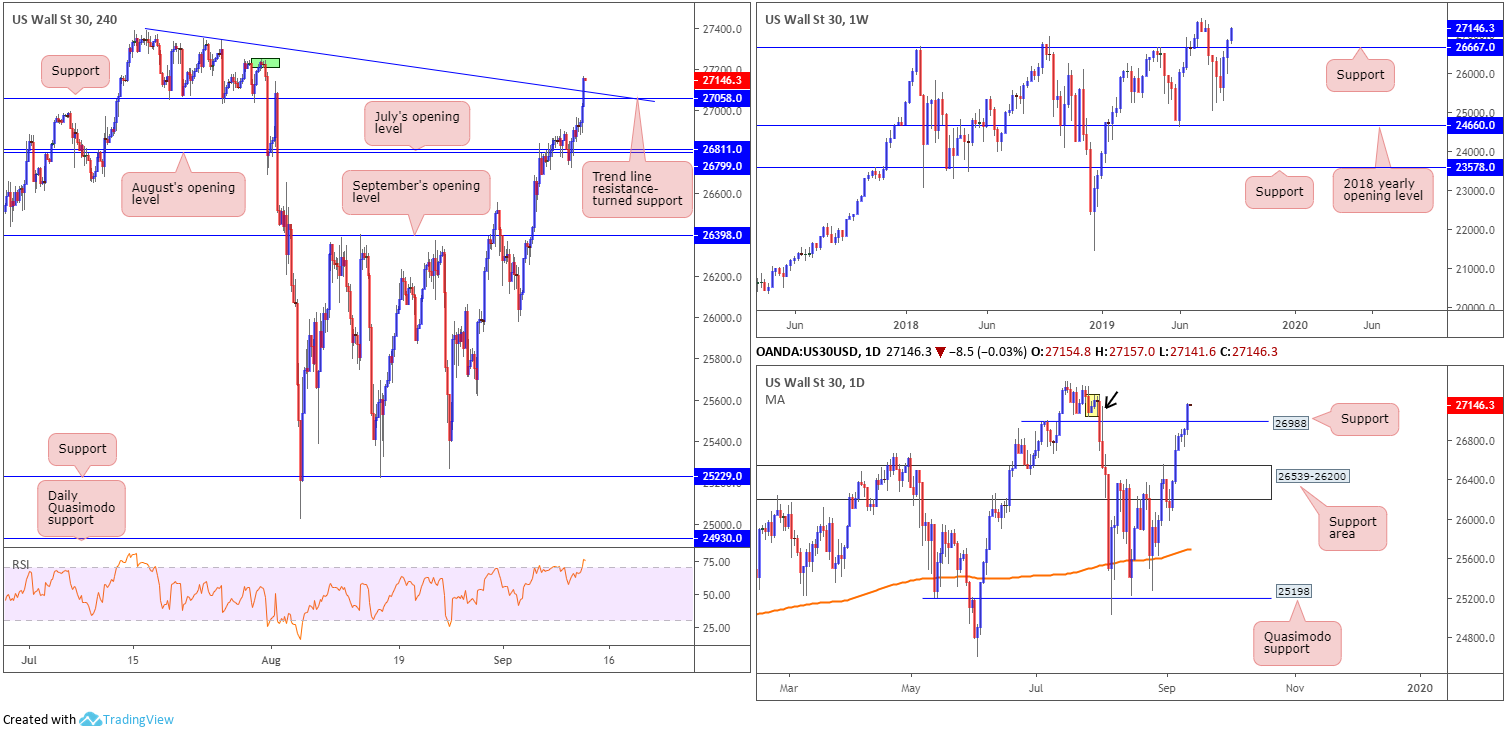
With respect to the technical scene on the Dow, weekly price continues to establish ground north of support at 26667, eyeing all-time highs at 27388. A retest at 26667 may also occur prior to exploring unchartered territory. Another constructive development, though on the daily timeframe, is the recent engulfing of Quasimodo resistance at 26988, now serving as possible support. A retest of this barrier may also come to fruition before we touch gloves with all-time highs. To the left of current price, traders may be looking at the supply area marked in yellow as a potential sell zone. Caution is advised here as the orders from this area appear mostly consumed by the wick marked with a black arrow at 27140.
A closer reading of price action on the H4 timeframe saw recent bidding overthrow resistance at 27058 (now acting support) and trend line resistance etched from the high 27388. To the upside, the research team notes possible supply around the 27219ish area (green) and is essentially the last line of defence until reaching all-time highs.
Areas of consideration:
On account of the above chart studies, longs are in favour. Therefore, a retest motion at the area between 26988 (the daily support level) and H4 support at 27058 is eyed. A retest formed by way of a H4 bullish candlestick signal will likely be sufficient to entice involvement even from the most conservative buyers. Entry and risk can be determined according to the candlestick’s structure, with a take-profit target set at the all-time high underscored above at 27388.
XAU/USD (GOLD):
Bullion, in $ terms, entered an offensive phase Wednesday, consequently snapping a four-day losing streak. Despite this, the uptick lacked meaningful conviction.
Regular readers will likely recall the following piece aired in Wednesday’s technical briefing:
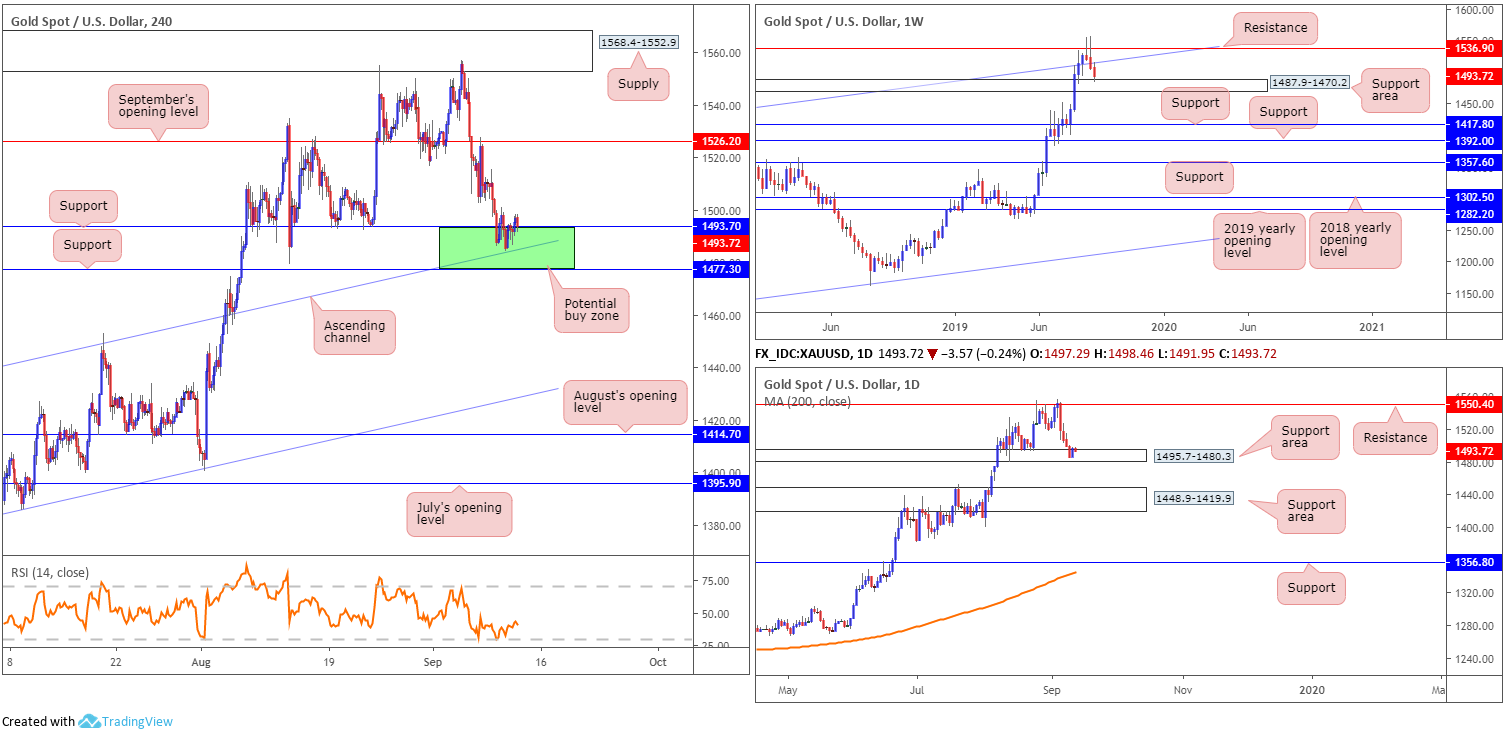
With USD bidding observed in Tuesday’s session, gold extended its losing streak to four consecutive days. This consequently brought a rather interesting area of support into the mix between 1477.3/1493.7 (green): two layers of H4 support and a channel resistance-turned support extended from the high 1437.7.
What’s also interesting is the higher-timeframe structure. Gold rotated lower from notable weekly resistance priced in at 1536.9 (boasts strong historical significance – check late 2011 and early 2012) last week by way of a bearish outside week (considered a bearish signal). Registering a close back beneath nearby channel resistance-turned support (taken from the high 1375.1), recent movement shook hands with a support area at 1487.9-1470.2.
As for the daily timeframe, we are now within the walls of a support area coming in at 1495.7-1480.3 with signs of buying present. A violation of this area has another support area in the firing range at 1448.9-1419.9.
Areas of consideration:
Outlook unchanged:
The green area on the H4 timeframe between 1477.3/1493.7 is considered a notable buy zone. Not only does it hold H4 channel support within, it merges with a daily support area coming in at 1495.7-1480.3, and the top edge of the weekly support area at 1487.9.
In Wednesday’s report, the research team stated the following:
Entry can be found anywhere within the green buy zone, with protective stop-loss orders positioned beneath 1477.3. For conservative traders desiring a little more confirmation, though, waiting for a H4 bullish candlestick formation to develop could be the way to go. This helps confirm buyer intent and provides entry and risk levels to trade with.
There was a nice-looking H4 inside candlestick formation printed in the early hours of trade Wednesday, which so far is holding firm. Well done to any of our readers long from the said H4 buy zone. The initial upside target from here is set around September’s opening level at 1526.2.
The accuracy, completeness and timeliness of the information contained on this site cannot be guaranteed. IC Markets does not warranty, guarantee or make any representations, or assume any liability regarding financial results based on the use of the information in the site.
News, views, opinions, recommendations and other information obtained from sources outside of www.icmarkets.com.au, used in this site are believed to be reliable, but we cannot guarantee their accuracy or completeness. All such information is subject to change at any time without notice. IC Markets assumes no responsibility for the content of any linked site.
The fact that such links may exist does not indicate approval or endorsement of any material contained on any linked site. IC Markets is not liable for any harm caused by the transmission, through accessing the services or information on this site, of a computer virus, or other computer code or programming device that might be used to access, delete, damage, disable, disrupt or otherwise impede in any manner, the operation of the site or of any user’s software, hardware, data or property.