Monday 16th September: Weekly technical outlook and review.

Key risk events today:
China Fixed Asset Investment ytd/y; China Industrial Production y/y; Japanese banks closed in observance of Respect-for-the-Aged Day.
EUR/USD:
Weekly gain/loss: +0.43%
Weekly close: 1.1072
Weekly perspective:
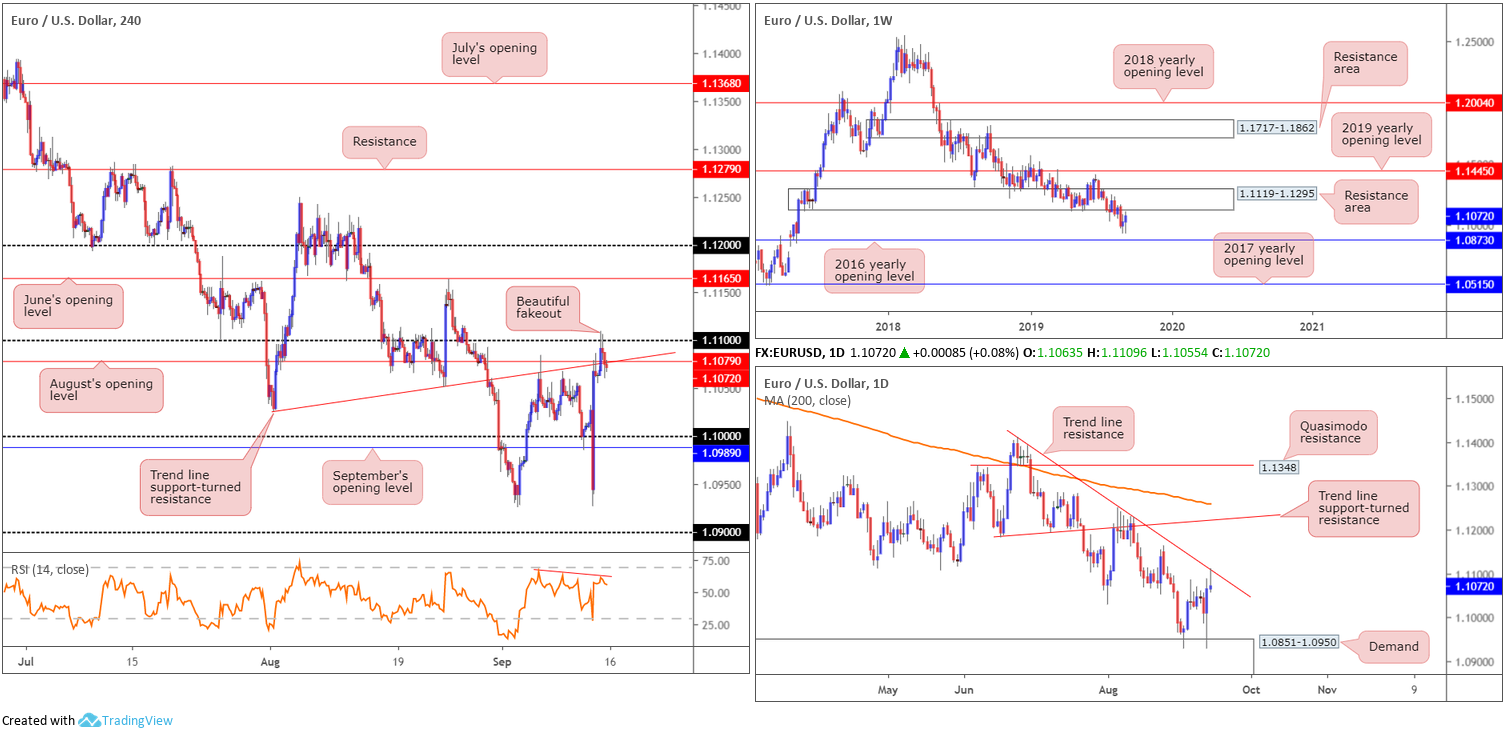
Despite closing out August engulfing long-term demand at 1.1119-1.1295, over recent weeks Europe’s shared currency staged an impressive recovery vs. the buck, adding 84 points. Current action is leaning towards a retest of the zone (marked a resistance area) with the 2016 yearly opening level at 1.0873 fixed as the next downside target.
Concerning trend direction, since topping in early 2018 at 1.2555, the long-term trend remains pointing in a southerly bearing.
Daily perspective:
Demand pencilled in at 1.0851-1.0950 – houses the 2016 yearly opening level inside its lower bounds – has contained price action since absorbing weekly demand mentioned above at 1.1119-1.1295. Thanks to strong bidding Thursday last week, forming a clear-cut bullish outside day construction, trend line resistance taken from the high 1.1412 entered the fold Friday and produced a shooting star candlestick pattern (considered a bearish signal).
Beyond the current trend line resistance, we have trend line support-turned resistance in sight (taken from the low 1.1181), closely trailed by a 200-day SMA construction (orange – 1.1257).
H4 perspective:
The post-European Central Bank (ECB) advance ran into fresh headwinds off the 1.11 handle Friday, withdrawing to a low of 1.1061 into the closing bell. Retail sales data out of the US favoured the greenback and sent US yields further to the upside. In addition to this, the preliminary reading of the University of Michigan’s Consumer Confidence Index showed a rebound from 89.8 to 92.0 in September.
Traders who read Friday’s report may recall the following piece:
Although the H4 candles are defending 1.1079, the 1.11 handle is prime for an attack, according to our chart studies. Round numbers, as most are aware, are prone to stop runs. This is due to the number of orders these levels attract. With the underside of weekly resistance set just north at 1.1119 and the daily trend line resistance that comes in a touch above the psychological mark, a fakeout through 1.11 to these higher-timeframe barriers is a reasonable possibility. Buy stops tripped above 1.11 and higher-timeframe sellers entering the fold from the said zones will likely cause strong selling, carrying price action back down to at least 1.10ish.
On account of the above, traders are urged to set alerts at 1.11. A fakeout through this number to the said higher-timeframe levels that closes south on a H4 basis is a strong sell signal, with entry on the close of the candle likely eyed and stops plotted above the fakeout high.
As evident from the H4 chart, price action did indeed whipsaw through 1.11, though only managed to draw in sellers from the daily trend line resistance. Indicator-based traders may also wish to acknowledge the RSI displays negative divergence (red line).
Areas of consideration:
Traders short the fakeout through 1.11 will likely have protective stop-loss orders above the fakeout high 1.1109, and entry at either the 1.1087 H4 candle close or the 1.1075. Regardless, the fact we have daily sellers involved, coupled with offered liquidity in the form of buy stops above 1.11, will likely be sufficient to drop price to at least 1.10ish this week, and possibly further, according to higher-timeframe structure.
GBP/USD:
Weekly gain/loss: +1.68%
Weekly close: 1.2494
Weekly perspective:
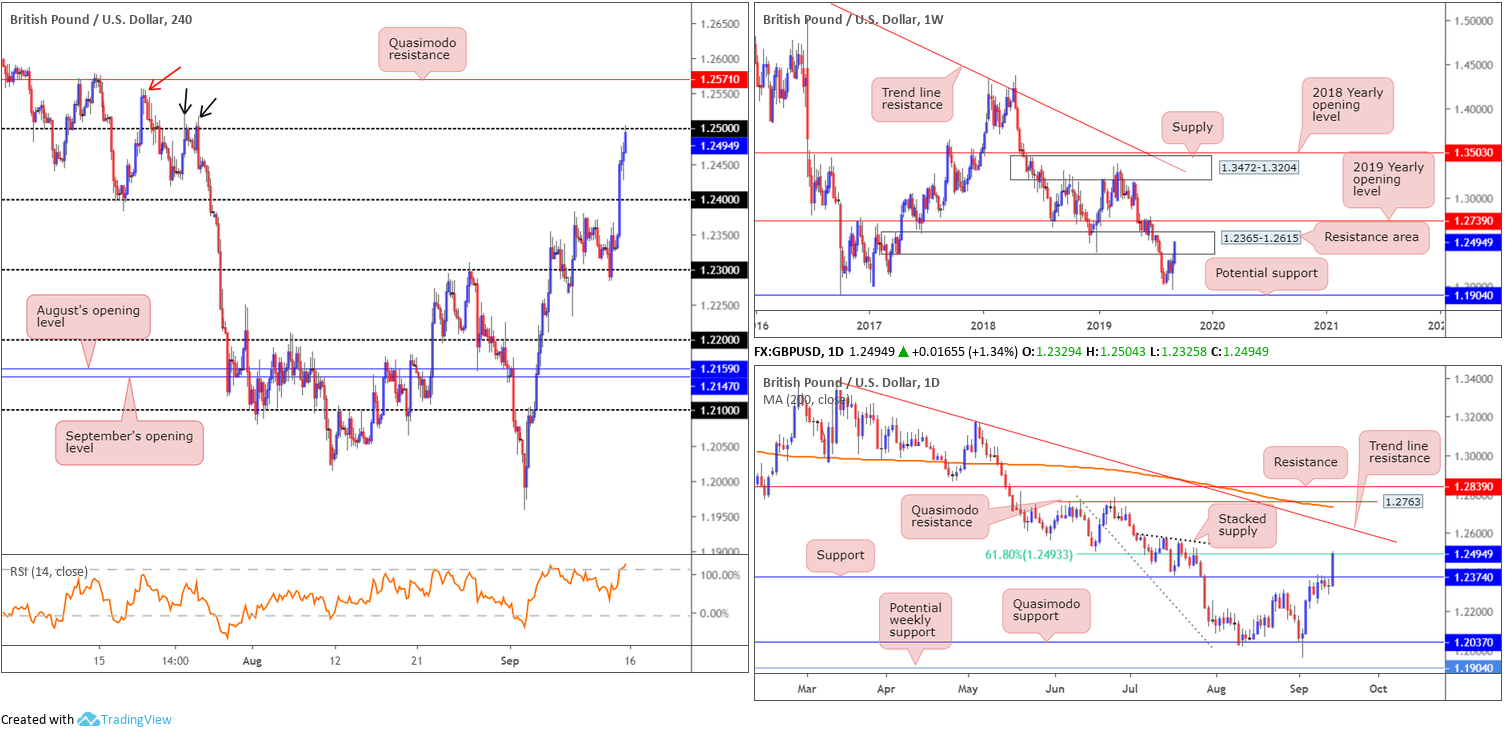
Following a sizeable bullish outside week shaped the week prior, last week’s movement added more than 200 points and pitched price into the walls of a long-term resistance area coming in at 1.2365-1.2615. Although this zone is expected to house active sellers, traders are urged to pencil in the 2019 yearly opening level at 1.2739 in the event we press for higher ground this week.
Daily perspective:
Friday witnessed the unit overthrow resistance at 1.2374 (now likely to serve as support) in strong fashion and challenge a 61.8% Fibonacci ratio set at 1.2493. Directly overhead, stacked supply is visible around 1.2560ish (black line), closely shadowed by trend line resistance etched from the high 1.3380, and then a Quasimodo resistance at 1.2763. It might also interest some traders to note the 200-day SMA is present around 1.2737.
H4 perspective:
The pound was on a tear Friday, expanding across the board. Sentiment turned positive towards the currency in recent days as investors price out risks of the UK crashing out of the EU without a deal.
1.24 was annihilated, with little stopping the unit from reaching 1.25 into the close. 1.25 served well as resistance late July (black arrows) and has the backing of a daily 61.8% Fibonacci ratio mentioned above at 1.2493 and a considerable weekly resistance area at 1.2365-1.2615. Beyond 1.25, nevertheless, Quasimodo resistance at 1.2571 is in the firing range. Interestingly, the high 1.2558 (red arrow), and the highs set beneath it (black arrows) at 1.2522ish, likely have buy stops plotted above. This may help provide liquidity to sell the said Quasimodo resistance.
Areas of consideration:
Shorts from 1.25 are certainly an option today, considering its connection to higher-timeframe resistances (see above). It is recommended, however, that traders consider waiting for additional H4 candlestick confirmation to form before pulling the trigger, as psychological figures are prone to whipsaws/fakeouts. What this does is help identify seller intent and provide entry and risk levels to work with. The first downside target can be found at 1.24, followed by daily support priced in at 1.2374.
A break of 1.25 to the upside, nonetheless, unbolts the door to further buying, at least until reaching the H4 Quasimodo resistance aired above at 1.2571. For those who want to press this bullish theme, waiting for a retest at 1.25 as support to develop is suggested (entry and risk can be found on the back of the rejecting candle’s structure).
AUD/USD:
Weekly gain/loss: +0.50%
Weekly close: 0.6879
Weekly perspective:
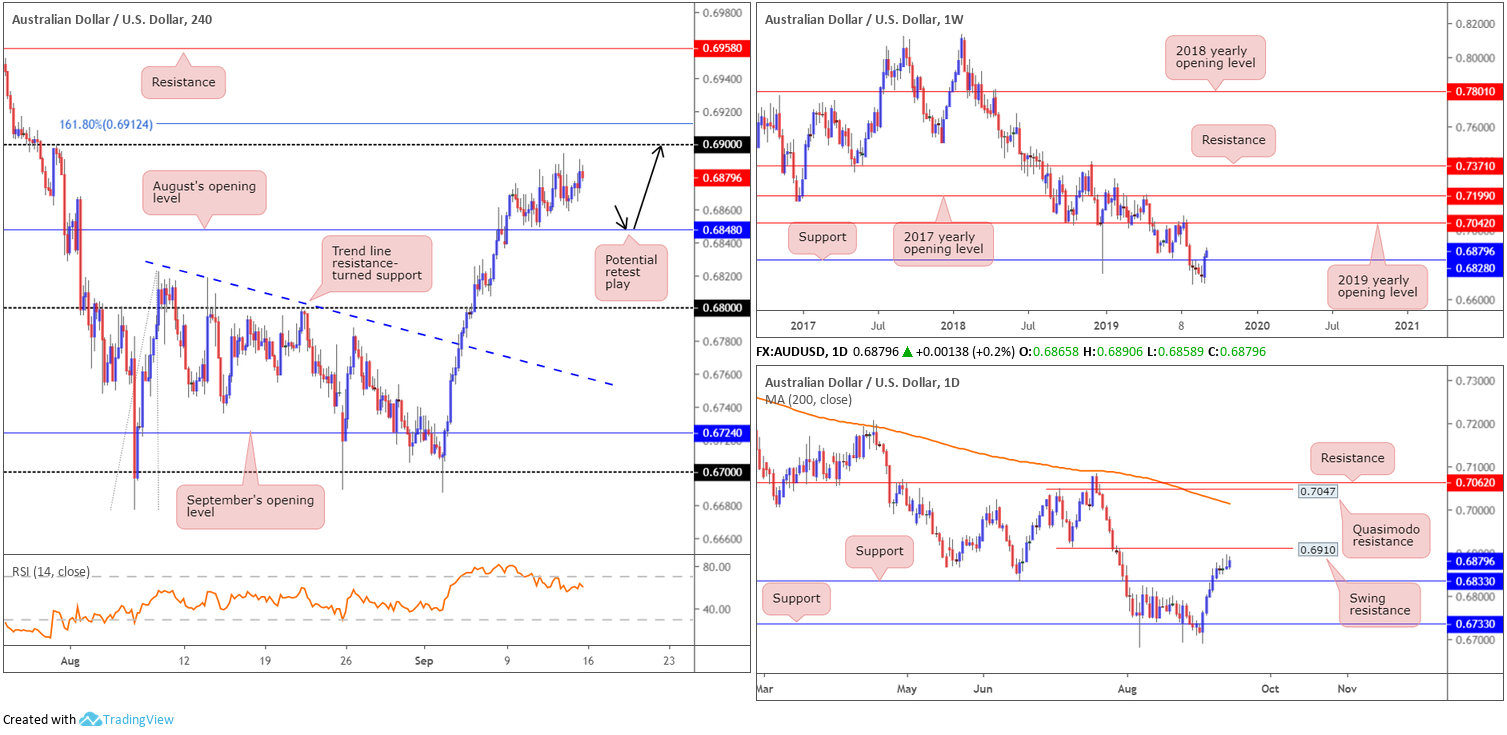
After staging a healthy comeback in recent weeks, involving the unit reclaiming position above support at 0.6828, further buying materialised last week, consequently posting a modestly healthy gain. If buyers remain in the driving seat, an approach towards the 2019 yearly opening level at 0.7042 is likely on the cards.
Daily perspective:
In conjunction with weekly structure, the daily timeframe also maintained a bullish position north of support at 0.6833. The next upside target on this scale falls in at 0.6910, a swing resistance. However, beyond here the research team has eyes on Quasimodo resistance at 0.7047 and resistance at 0.7062. It might also interest some traders to note the 200-day SMA lurks close by at 0.7011 (orange).
H4 perspective:
Latest headlines surrounding the US/China trade war and a fading buck helped the pair preserve an upside bias Friday. US Treasury Secretary Mnuchin, on Thursday evening, stated he was hopeful progress will be made in trade talks. China’s State Council also announced they have decided to exclude some agricultural products including soybeans and pork from retaliatory tariffs on US imports.
Since engulfing August’s opening level at 0.6848, price has been grinding higher within a tight channel formation. With upside pointing to 0.69 from current price, closely followed by a 161.8% Fibonacci ext. point at 0.6912, longs remain favoured.
Areas of consideration:
Considering the bullish theme on the higher timeframes right now, entering long based on a retest at August’s opening level drawn from 0.6848 on the H4 is still the favoured option (black arrows). A retest of this level in the shape of a H4 bullish candlestick signal will likely entice buyers into the market, with eyeballs on 0.69 as the initial upside target, set just beneath daily resistance at 0.6910 and the 161.8% H4 Fibonacci ext. point mentioned above at 0.6912.
Should this trade eventually come to fruition, traders are also urged to take into account the tops formed just south of 0.69 which could house active sellers.
USD/JPY:
Weekly gain/loss: +1.09%
Weekly close: 108.06
Weekly perspective:
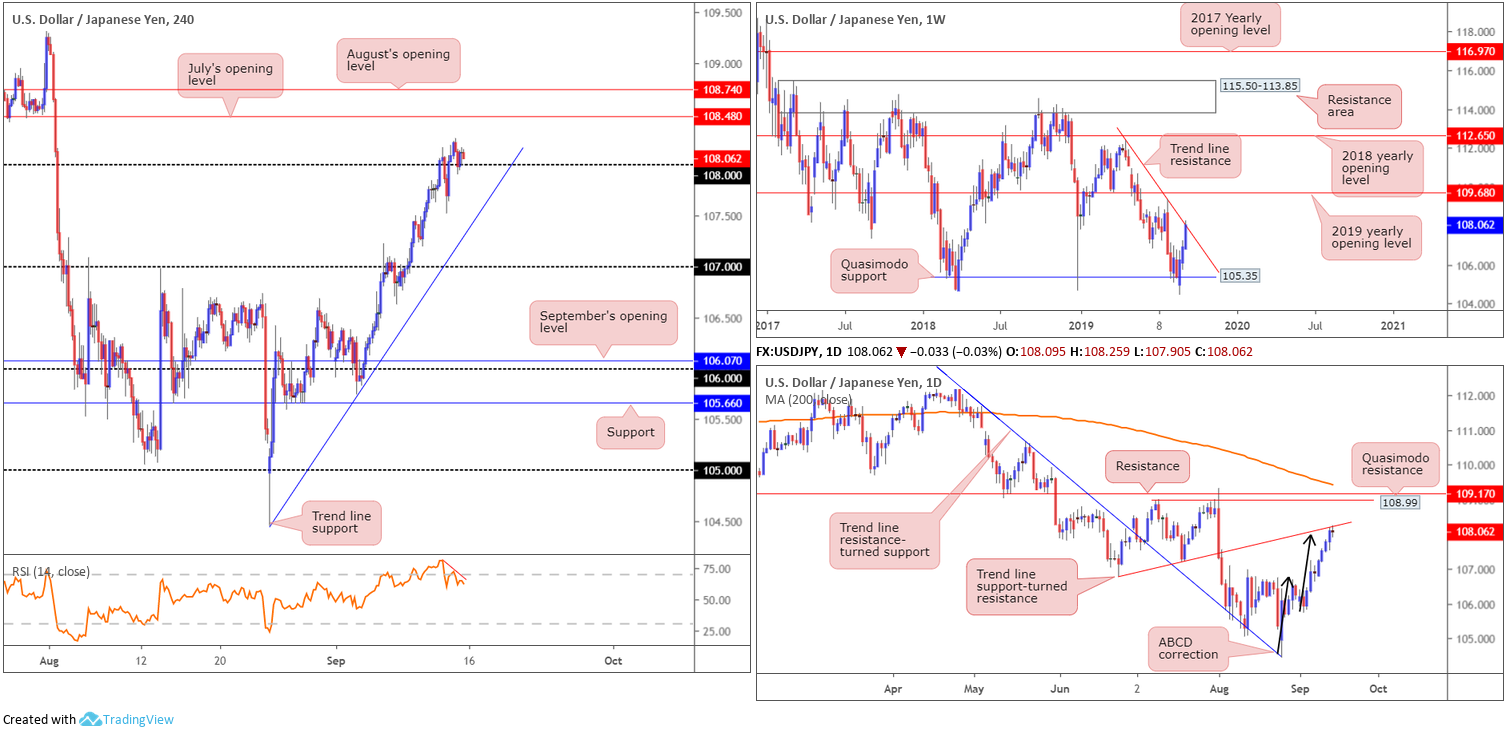
The recovery from Quasimodo support at 105.35 has so far been impressive, shaped in the form of three back-to-back bullish closes. With that being said, though, last week concluded around the underside of trend line resistance (extended from the high 112.40), which could potentially throw a spanner in the works this week.
Additional upside has the 2019 yearly opening level at 109.68 in sight.
Daily perspective:
The story on the daily timeframe has trade crossing swords with a trend line support-turned resistance (etched from the low 106.78) in the shape of an ABCD correction terminating at 108. Since crossing paths with the said trend line, price action has established little in terms of rejection. In fact, Friday’s candle wrapped up by way of a Doji formation, suggesting an indecisive tone is present in the market.
H4 perspective:
Friday witnessed price action gain traction above 108 post-US retails sales, though struggled to sustain gains into the close. As highlighted in previous reports, buy stops above the 108 handle are well and truly under fire. Continued bidding above 108 places July’s opening level at 108.48 in view as the next viable resistance, closely followed by August’s opening level at 108.74. A rotation back beneath 108, however, has trend line support (extended from the low 104.44) to target.
Areas of consideration:
While Thursday’s initial stop run above 108 drew the candles more than 50 points lower, the swift turnaround and repossession of 108 is concerning for any seller. However, what’s likely stopping a run to July’s opening level at 108.48 on the H4 timeframe is the trend line resistances on both the weekly and daily timeframes.
Given higher-timeframe structure, should H4 price reclaim 108 to the downside once again and form a reasonably notable bearish candlestick formation on a retest (entry and risk can be determined according to this structure), a short is still worthy of consideration this week, targeting the noted H4 trend line support, followed by the 107 handle.
USD/CAD:
Weekly gain/loss: +0.91%
Weekly close: 1.3284
Weekly perspective:
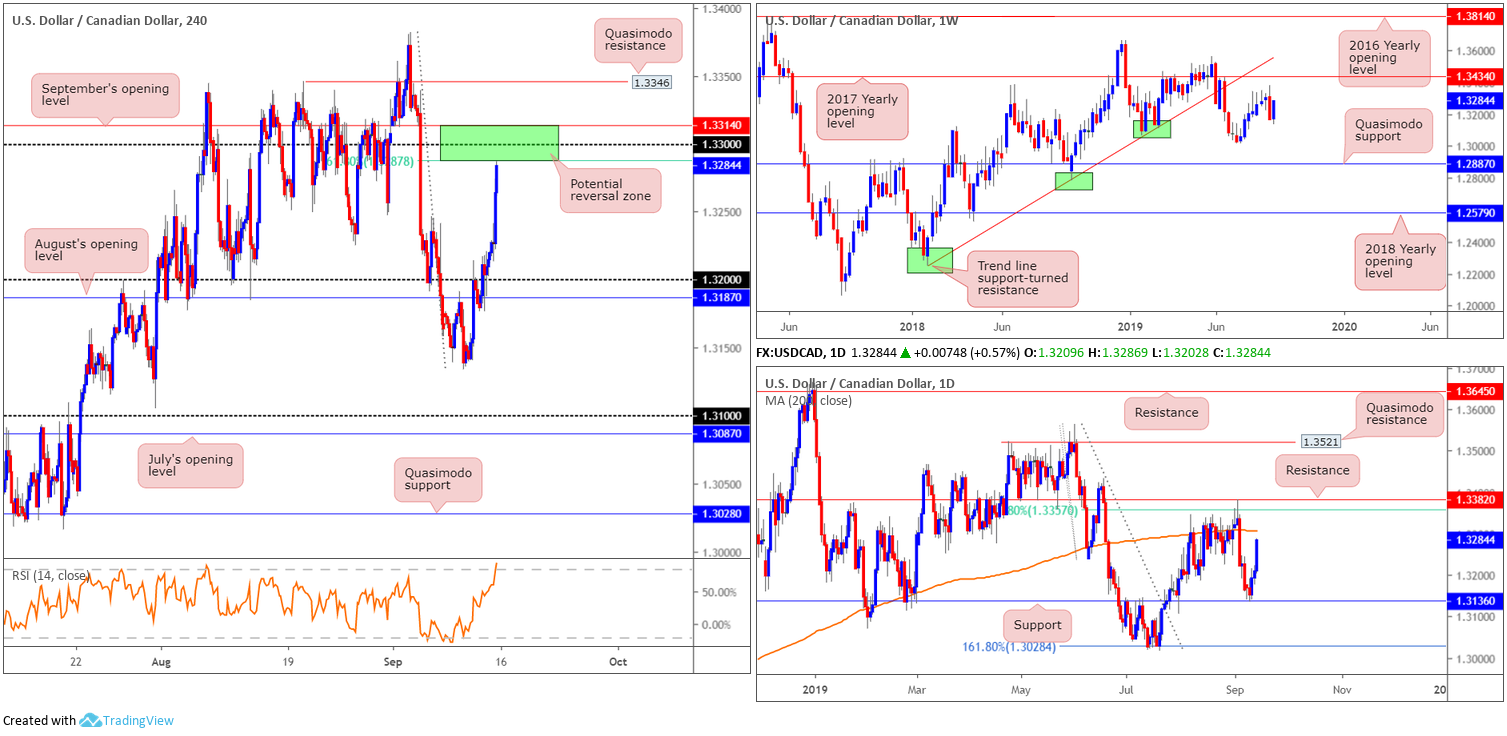
USD/CAD bulls entered an offensive phase last week, consequently correcting a large portion of the prior week’s precipitous decline. Resistance on this timeframe is fixed at the 2017 yearly opening level drawn from 1.3434, closely trailed by a trend line support-turned resistance extended from the low 1.2247. To the downside, nonetheless, we have the 1.3016 July 15 low, followed by Quasimodo support at 1.2887.
Daily perspective:
Tuesday saw the unit dip its toe into a familiar support at 1.3136, which followed through with a bullish engulfing candle Wednesday with additional bidding observed. Resistance in the form of a 200-day SMA (orange) at 1.3307 is now in the offing, tracked by a 61.8% Fibonacci resistance at 1.3357 and resistance at 1.3382.
H4 perspective:
Motivated by upbeat US retail sales data and fading WTI prices (printed its fourth consecutive daily loss), USD/CAD movement broke out of its subdued range in early US trade Friday and settled the week at the underside of a 61.8% Fibonacci ratio at 1.3287. Overhead, additional layers of resistance are visible at the 1.33 handle and September’s opening level at 1.3314. Note also the 200-day SMA (orange) intersects with this neighbourhood and, for indicator-based traders, the RSI is seen tackling overbought territory.
Areas of consideration:
The area between September’s opening level at 1.3314, the round number 1.33 and the 61.8% Fibonacci ratio at 1.3287 (1.3314/1.3287) is likely a zone of interest for sellers this week – even more so knowing we have the 200-day SMA housed within. For traders looking to add a little more confirmation to the mix before engaging, consider waiting for candlestick confirmation to develop. For example, a H4 bearish engulfing formation moulded off the 1.33 handle not only identifies seller intent, it also delivers entry/risk levels to work with. As for downside targets, the 1.32 handle is a logical starting point, followed by August’s opening level at 1.3187.
USD/CHF:
Weekly gain/loss: +0.27%
Weekly close: 0.9899
Weekly perspective:
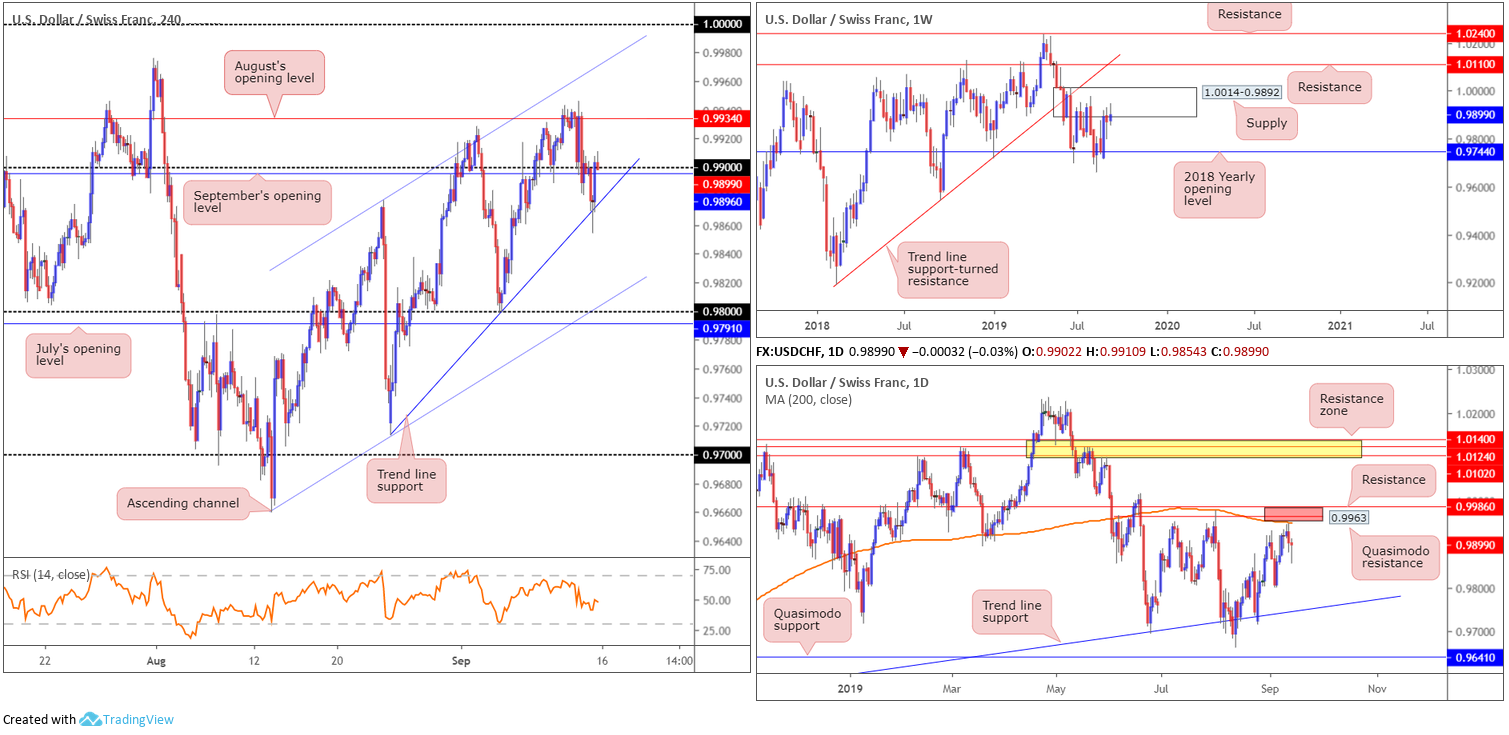
Longer-term flow has action engaging with familiar supply coming in at 1.0014-0.9892. This is the second time back to the area and, therefore, its strength may be compromised.
A rotation lower from here, nevertheless, has the 2018 yearly opening level at 0.9744 in sight. In the event buyers brush aside the said supply (unlikely a straightforward feat but certainly a possibility), resistance at 1.0110 is in view, as is long-term trend line support-turned resistance taken from the low 0.9187.
Daily perspective:
Daily activity fashioned a clear bearish outside day Thursday, though left an interesting area of resistance at 0.9986/0.9953 unopposed by a few points (Quasimodo resistance at 0.9963, a 200-day SMA [orange – 0.9953] and resistance coming in from 0.9986 [red]). Friday attempted to extend Thursday’s move, but failed off session lows of 0.9854, consequently establishing a robust lower shadow.
Continued downside this week may call for a revisit of trend line support (extended from the low 0.9542), as demand to the left of price appears consumed.
H4 perspective:
Early European trade Friday witnessed a break of 0.99 to the downside and a test of nearby trend line support taken from the low 0.9713 into US hours. Common viewing typically sees some form of reversal occur as US traders enter the fight; in this case it was off the said trend line support, which resulted in a retest at 0.99 by the day’s end. Outside 0.99, immediate resistance resides around August’s opening level at 0.9934 and a channel resistance drawn from the high 0.9877.
Areas of consideration:
Selling this market, though appealing on the weekly and daily timeframes, is difficult according to H4 structure. It would, as highlighted in Friday’s analysis, take a break of trend line support (0.9713) to clear sufficient space to channel support (0.9659)/0.98 handle.
The daily resistance area between 0.9986/0.9953 is still open for possible shorting opportunities in the event we turn higher this week. As emphasised in previous reports, an ideal entry point would be the H4 channel resistance taken from the high 0.9877, as this line intersects with the upper boundary of the said daily zone. A test of the H4 channel area in the shape of a H4 bearish candlestick signal (entry and risk to be set according to this structure) is considered a high-probability setup with the likelihood of a sizeable move occurring from its formation.
Dow Jones Industrial Average:
Weekly gain/loss: +1.47%
Weekly close: 27231
Weekly perspective:
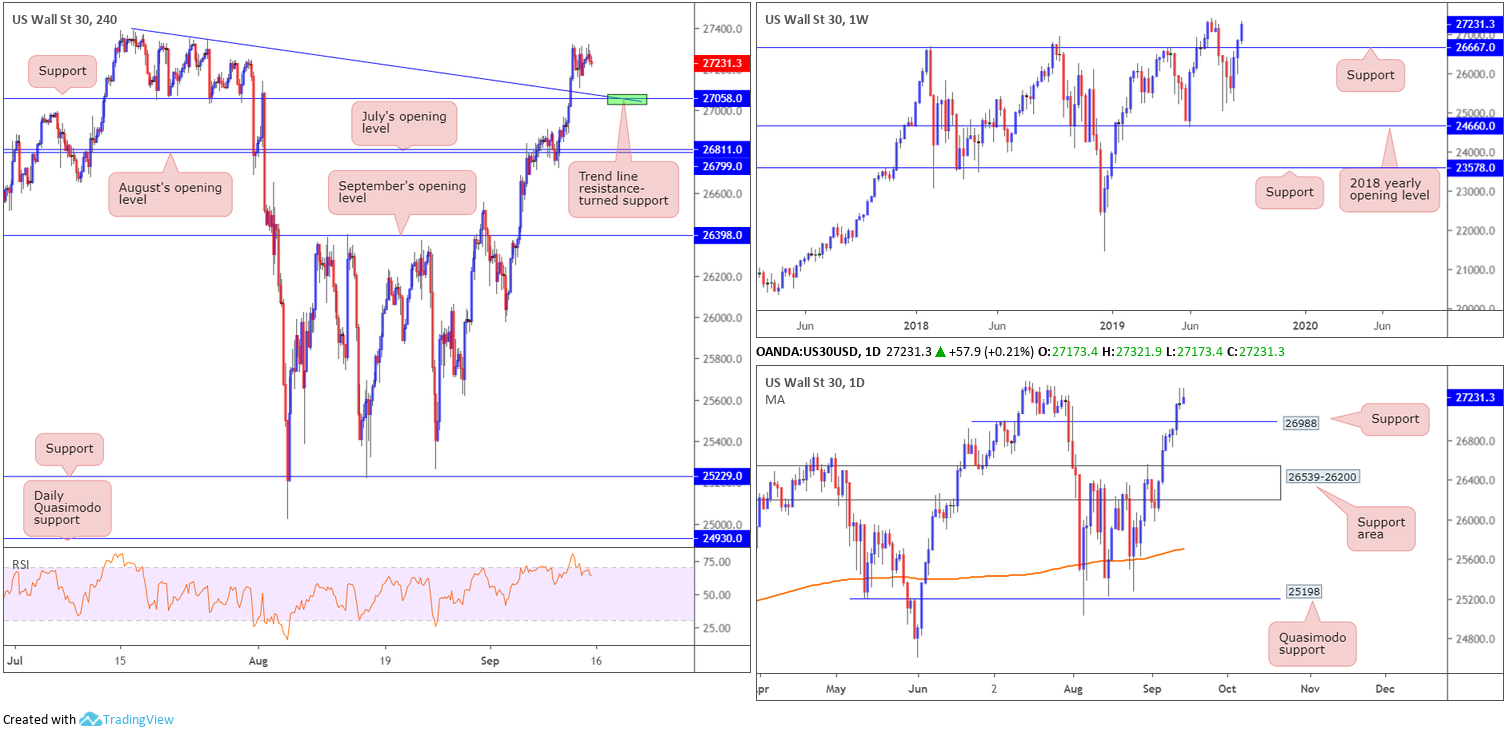
US equities notched a third consecutive weekly gain last week, according to the Dow Jones Industrial Average. Adding nearly 400 points, the index settled the week extending its position north of support at 26667 and a short walk from the all-time high 27388.
Daily perspective:
As highlighted in Thursday’s report, daily price engulfed Quasimodo resistance at 26988 last week and now serves as possible support. A retest of this barrier may come to fruition before we touch gloves with all-time highs.
H4 perspective:
The Dow Jones Industrial Average firmed Friday, posting its first eight-day winning streak in more than a year, amid improving sentiment around US/China trade relations. The Dow added 37.07 points Friday, or 0.14%; the S&P 500 ended the day unchanged at minus 2.18 points, or 0.07% and the tech-heavy Nasdaq 100 declined 24.39 points, or 0.31%.
With respect to the Dow’s technical landscape on the H4 scale, price action is poised to approach all-time highs at 27388. Last week Wednesday observed the index overthrow resistance at 27058 (now acting support) and trend line resistance etched from the high 27388, with Thursday/Friday’s activity directionless, confined to tight consolidations at the top edge of Wednesday’s range.
Areas of consideration:
Outlook unchanged.
On account of the above chart studies, longs remain in favour this week. A retest at the area between 26988 (the daily support level) and H4 support at 27058 is eyed, specifically the point which H4 support intersects with trend line support (green). A retest formed by way of a H4 bullish candlestick signal will likely be sufficient to entice involvement even from the most conservative buyers. Entry and risk can be set according to the rejecting candlestick’s structure, with a take-profit target fixed at the all-time high underscored above at 27388.
XAU/USD (GOLD):
Weekly gain/loss: -1.20%
Weekly close: 1488.5
Weekly perspective:
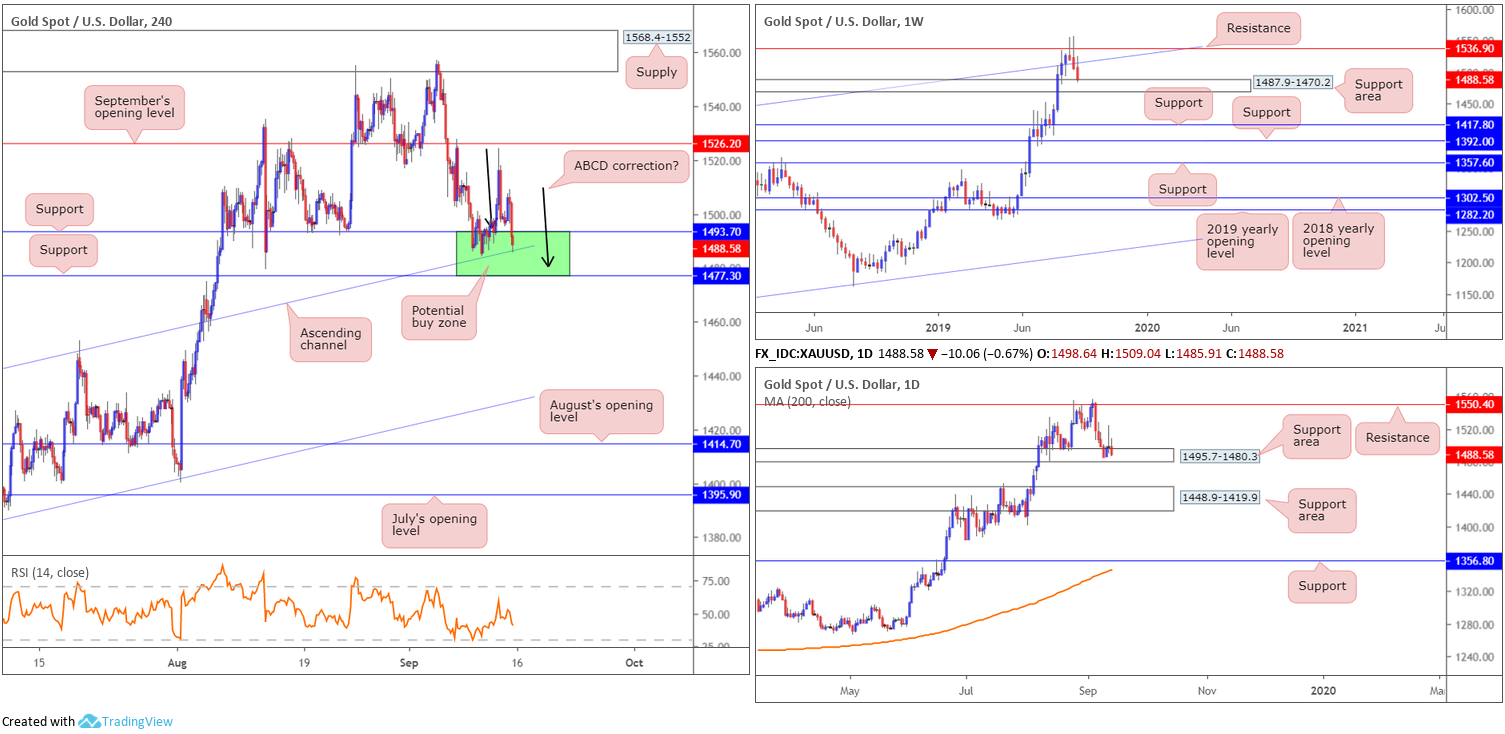
Since breaking a strong four-week bullish phase, bullion rotated lower from notable resistance priced in at 1536.9 (boasts strong historical significance – check late 2011 and early 2012) and logged a further two consecutive losing sessions since. Recent selling positioned the yellow metal back beneath nearby channel resistance-turned support (taken from the high 1375.1) and at the top edge of a support area coming in at 1487.9-1470.2 (drawn from April 2013).
Daily perspective:
Resistance at 1550.4 capped upside in recent weeks, consequently guiding the daily candles towards a support area at 1495.7-1480.3. Glued to the top edge of the current weekly support area, we can see this is the third time back to this zone in the space of a month. So far, buyers are lacking oomph out of this zone, airing the prospect of a run towards another layer of support coming in at 1448.9-1419.9 this week.
H4 perspective:
Risk-on flows continued to weigh on the precious metal Friday, alongside upbeat retail sales out of the US. The week concluded with the H4 candles engaging with a familiar area of support marked in green at 1477.3/1493.7. Not only does it hold H4 channel support within (pencilled in from the high 1437.7), it merges with a daily support area coming in at 1495.7-1480.3, and the top edge of the weekly support area at 1487.9. Another constructive development worth underlining is a possible ABCD correction (black arrows) at 1480.8, essentially marking the lower edge of the current daily support zone.
Areas of consideration:
Considering the current market trend and the likelihood the current retracement is simply a pullback, the area of support stationed on the H4 timeframe between 1477.3/1493.7 remains an option for long opportunities this week. The research team specifically favours the H4 channel resistance-turned support as an entry point (entered the mix Friday) and the completion of the ABCD correction around 1480.8. For conservative traders desiring a little more confirmation, waiting for a H4 bullish candlestick formation to develop could be the way to go. This helps confirm buyer intent and provides entry and risk levels to trade with. Concerning upside targets, September’s opening level at 1526.2 remains a logical starting point.
The accuracy, completeness and timeliness of the information contained on this site cannot be guaranteed. IC Markets does not warranty, guarantee or make any representations, or assume any liability regarding financial results based on the use of the information in the site.
News, views, opinions, recommendations and other information obtained from sources outside of www.icmarkets.com.au, used in this site are believed to be reliable, but we cannot guarantee their accuracy or completeness. All such information is subject to change at any time without notice. IC Markets assumes no responsibility for the content of any linked site.
The fact that such links may exist does not indicate approval or endorsement of any material contained on any linked site. IC Markets is not liable for any harm caused by the transmission, through accessing the services or information on this site, of a computer virus, or other computer code or programming device that might be used to access, delete, damage, disable, disrupt or otherwise impede in any manner, the operation of the site or of any user’s software, hardware, data or property.