EUR/USD ticks lower after release of Eurozone PMIs
![]()
- EUR/USD ticks lower immediately following the release of Eurozone April PMI data.
- The weakness is driven by the HCOB Manufacturing PMI which falls deeper into contraction territory.
- The pair has formed a Bear Flag price pattern suggesting the potential for a steep decline.
EUR/USD ticks lower into the 1.0670s on Tuesday, immediately following the release of preliminary Eurozone Purchasing Manager Index (PMI) data for April.
The decline is driven by a lower-than-expected reading for HCOB Manufacturing PMI which recorded a deeper decline into contraction territory below 50.
EUR/USD falls after weak Manufacturing PMI data
EUR/USD declines after the release of the HCOB Manufacturing PMI misses estimates, falling to 45.6 in April versus the 46.5 expected and 46.1 of March.
HCOB Composite PMI for the Eurozone rose to 51.4, however, which was above the 50.8 forecast and the 50.3 in March. The gain was driven by the HCOB Services PMI which increased to 52.9 in April – higher than both the 51.8 forecast and the 51.5 previous.
S&P Global PMIs for America will be released during the US session and are likely to further impact the EUR/USD pair.
The S&P Global Manufacturing PMI for the US in April is forecast to rise to 52.0 from 51.9 and Services to 52.0 from 51.7.
A PMI figure above 50 is indicative of growth in the sector; below 50 contraction. If any of the data show higher-than-expected readings, they could benefit the respective currencies and vice versa for lower-than-forecast results.
Of particular interest to currency traders will be Services PMIs since sticky inflation in the sector has been a major contributor to inflation, especially in the US.
Continued high inflation in the US is viewed as likely to keep interest rates relatively elevated in the United States compared to Europe. The expectation of higher borrowing costs for longer in the US has been bolstering the US Dollar (USD) since higher interest rates attract greater capital inflows.
In addition, later in the day, the US will also see the release of New Home Sales data for March and the Richmond Fed Manufacturing Index for April.
Technical Analysis: EUR/USD forms a Bear Flag
EUR/USD is trading in a rectangular range at roughly the same level as the 100-week Simple Moving Average (SMA).
Taken together with the steep decline that preceded the rectangle, the whole formation resembles a Bear Flag price pattern, which has bearish connotations.
EUR/USD 4-hour Chart
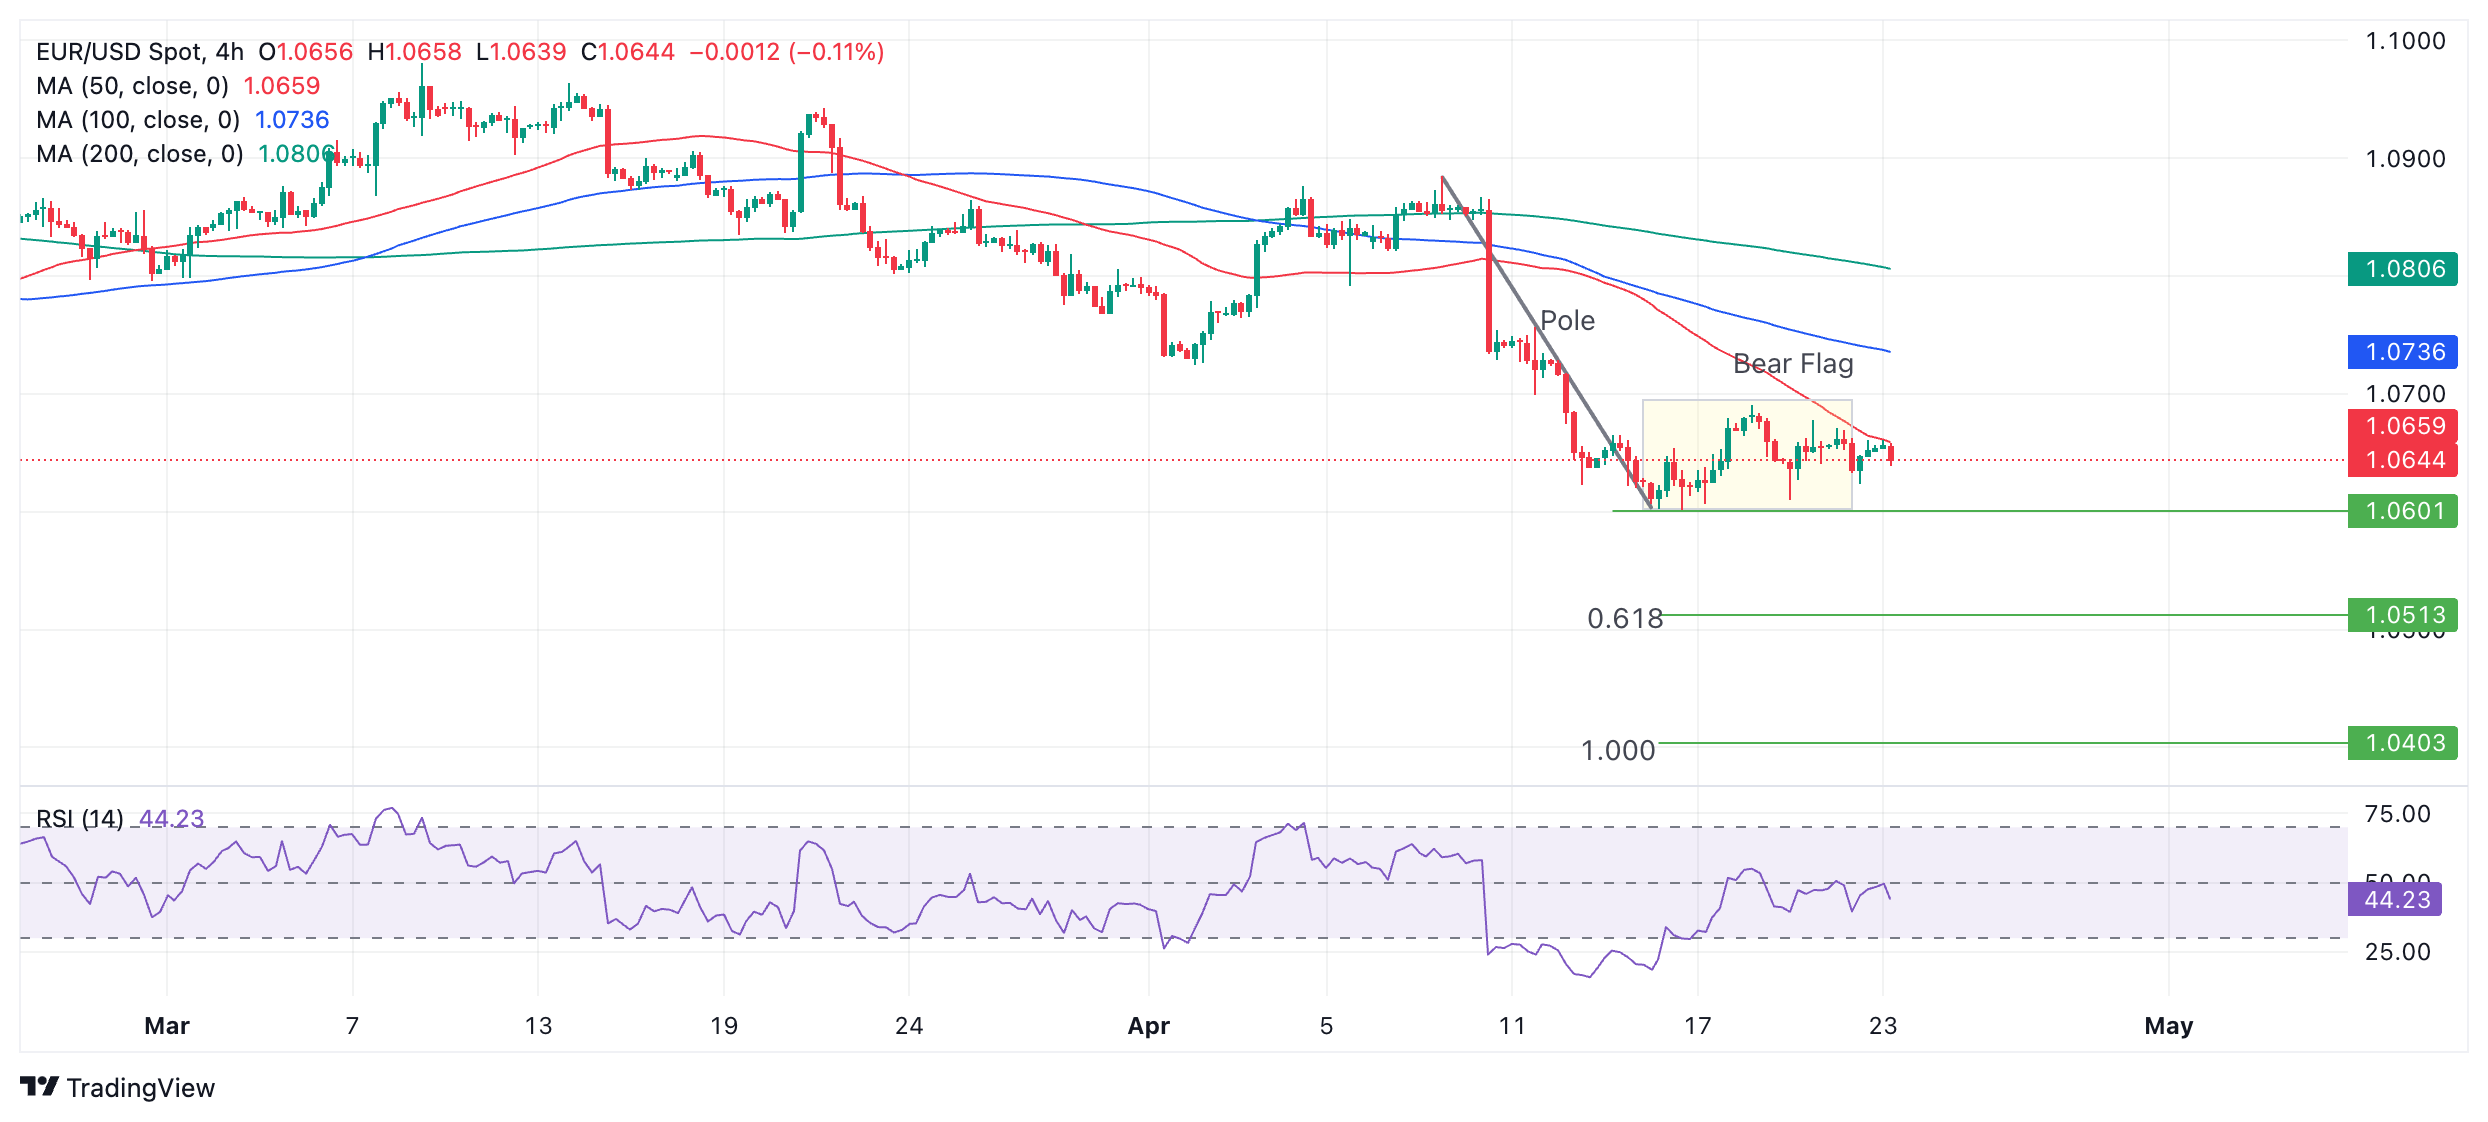
A break below the 1.0601 April 16 low would signal a probable activation of the Bear Flag and the start of a decline.
According to technical lore, the expected move out of a Bear Flag usually equals the length of the “pole” or steep decline preceding the box-like formation of the flag square, or a Fibonacci ratio of the pole.
The Fibonacci 0.618 ratio of the pole extrapolated lower provides the most reliable conservative target. This gives a price objective at 1.0503. After that, the next concrete target is at 1.0446 – the October 2023 low. A fall of equal length to the pole would take EUR/USD down to 1.0403.
The Relative Strength Index (RSI) has exited oversold conditions, indicating renewed potential for more downside.
For bulls, resistance at around 1.0700 will need to be overcome to have any hope of recovery. After that, the April 2 swing low at 1.0725 provides the next upside target, followed by 1.0800, where a cluster of major Moving Averages coils.
Economic Indicator
HCOB Manufacturing PMI
The Manufacturing Purchasing Managers Index (PMI), released on a monthly basis by S&P Global and Hamburg Commercial Bank (HCOB), is a leading indicator gauging business activity in the Eurozone manufacturing sector. The data is derived from surveys of senior executives at private-sector companies from the manufacturing sector. Survey responses reflect the change, if any, in the current month compared to the previous month and can anticipate changing trends in official data series such as Gross Domestic Product (GDP), industrial production, employment and inflation. The index varies between 0 and 100, with levels of 50.0 signaling no change over the previous month. A reading above 50 indicates that the manufacturing economy is generally expanding, a bullish sign for the Euro (EUR). Meanwhile, a reading below 50 signals that activity among goods producers is generally declining, which is seen as bearish for EUR.
Last release: Tue Apr 23, 2024 08:00 (Prel)
Frequency: Monthly
Actual: 45.6
Consensus: 46.5
Previous: 46.1
Source: S&P Global