Kyber Network creates bridge between traditional finance and DeFi while KNC attempts to recover
![]()
- Kyber Network has released a new infrastructure aimed at participating in DeFi.
- KNC is trading inside a descending triangle pattern, awaiting a clear breakout.
Kyber Network has just released the KyberPRO framework intended for on-chain market making. According to the team behind the launch, current automated market makers are not optimal and offer no control over the pricing.
KyberPRO – The new market-making service for DeFi liquidity
Providing liquidity can be a tough job, especially if the user intends to run a profitable operation. Most processes are simply too expensive, and the risk of losing capital due to impermanent loss is high. KyberPRO wants to solve this issue by providing a new and robust liquidity system and technical support to enable market makers to join DeFi easily.
It seems that some big players are already joining or looking into the new service. DV Chain and OneBit Quant have shown interest in KyberPRO and are currently exploring all the marketing making opportunities available. Garrett See, CEO of DV Chain, stated:
DV Chain has worked closely with Kyber Network to help bridge the gap between traditional trading and DeFi. We strongly believe that the solutions Kyber is building are of great importance to our industry and to the future of the digital economy.
KNC could be on the verge of a significant breakout
KNC is currently trading at $0.92 inside a daily descending triangle pattern. The pattern’s lower trendline has served as a robust support level defended on several occasions from September to October.
KNC/USD daily chart
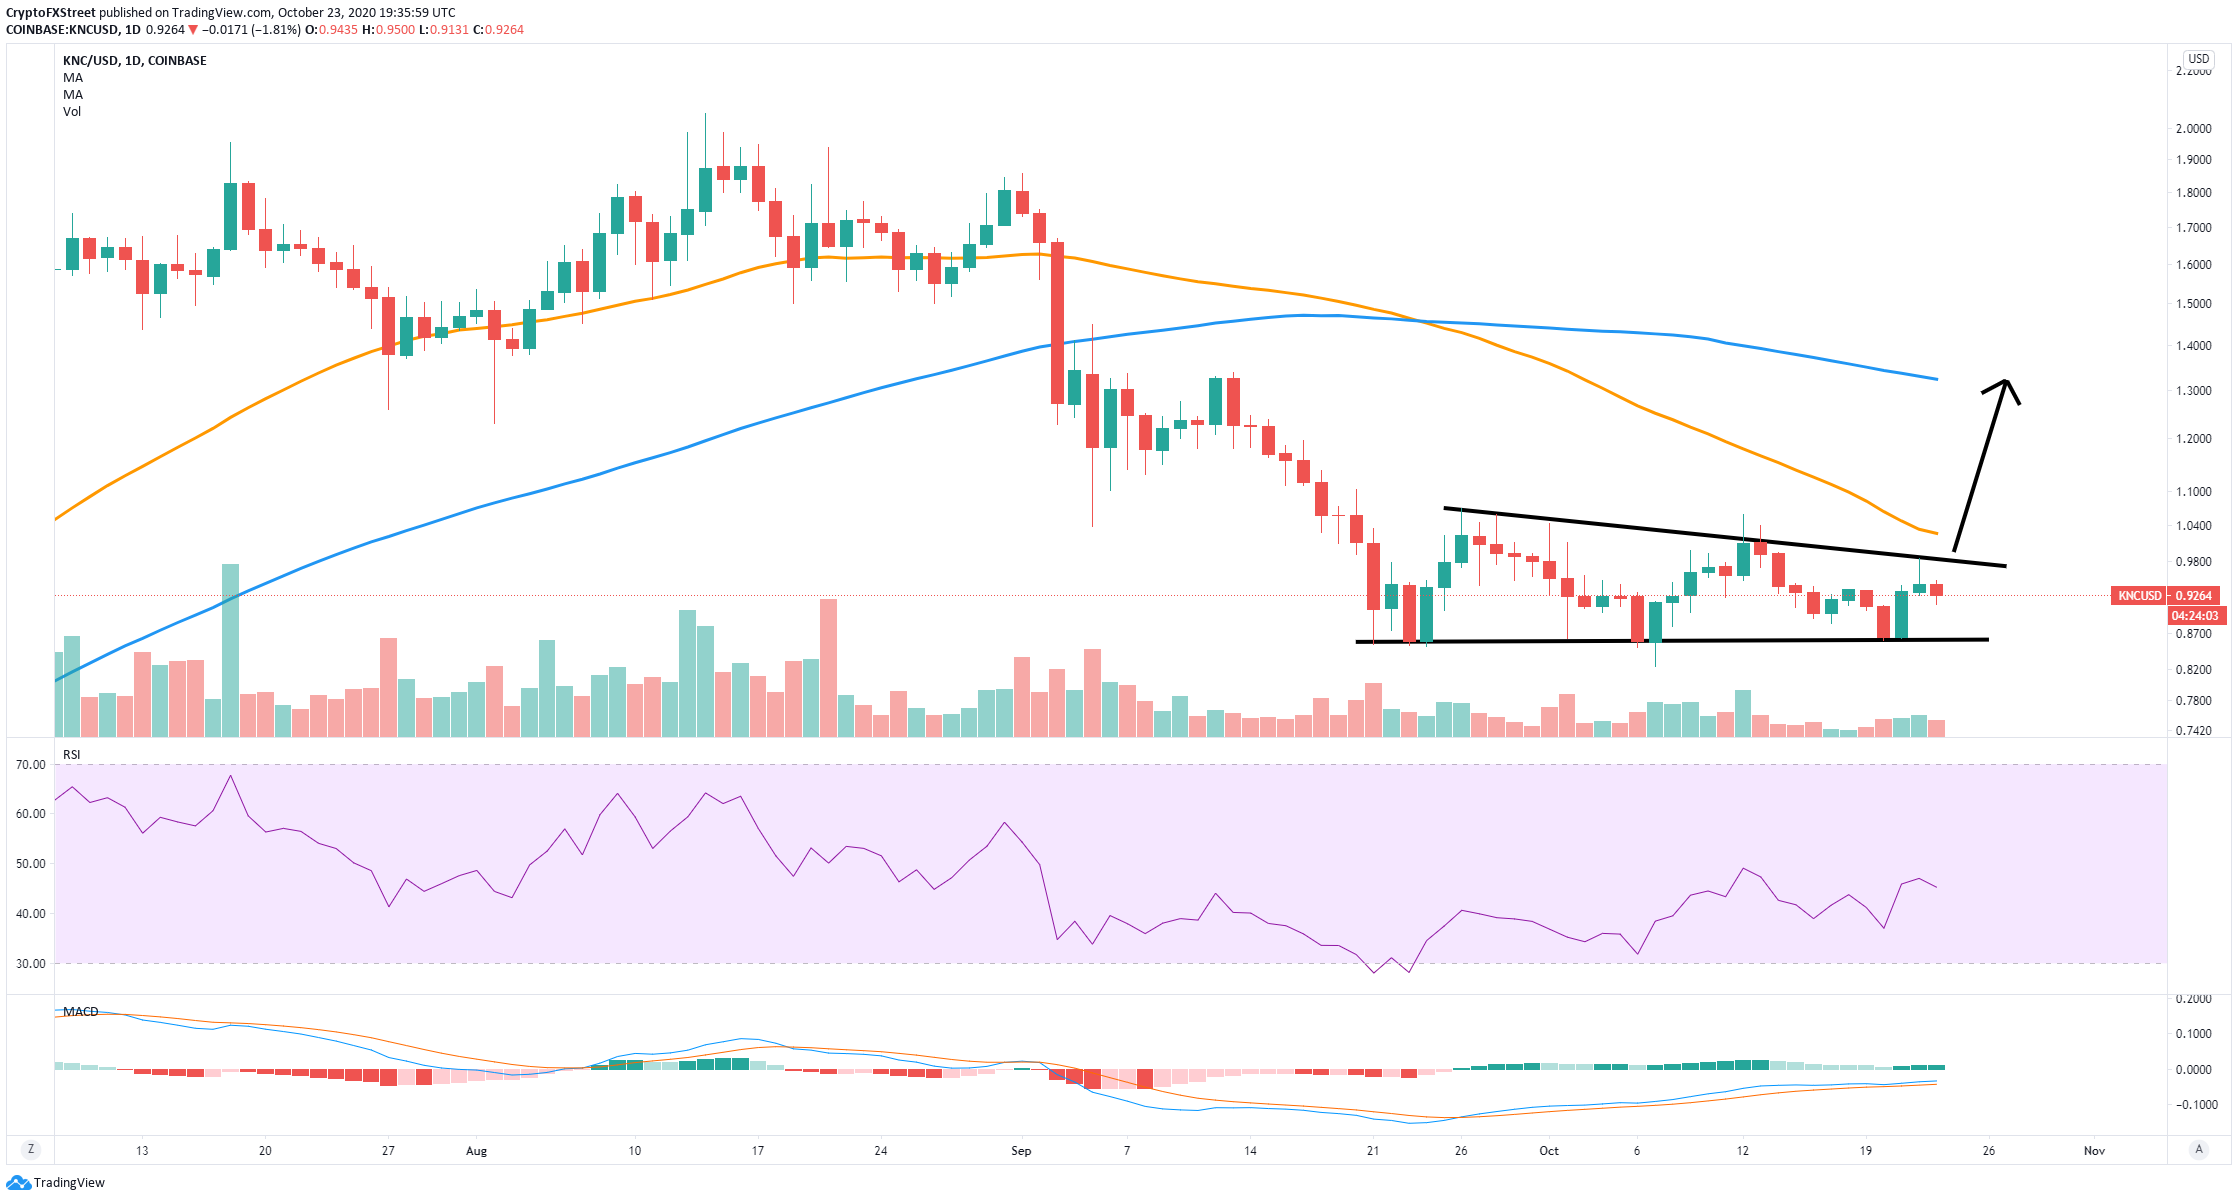
The current price is close to the upper trendline at $0.98. The MACD has been bullish since September 25, and it’s gaining momentum again. A breakout above the pattern’s upper trendline can easily push KNOC up to the 200-SMA at $1.14 and as high as $1.32, where the 100-SMA stands.
KNC New Addresses and Active Addresses Chart
 [21.37.52, 23 Oct, 2020]-637390790024467297.png)
Additionally, it seems that there is some positive on-chain activity for KNC in the past seven days, which coincides with the increase in prices. The number of new addresses joining the network and daily active addresses increased notably in the past week.
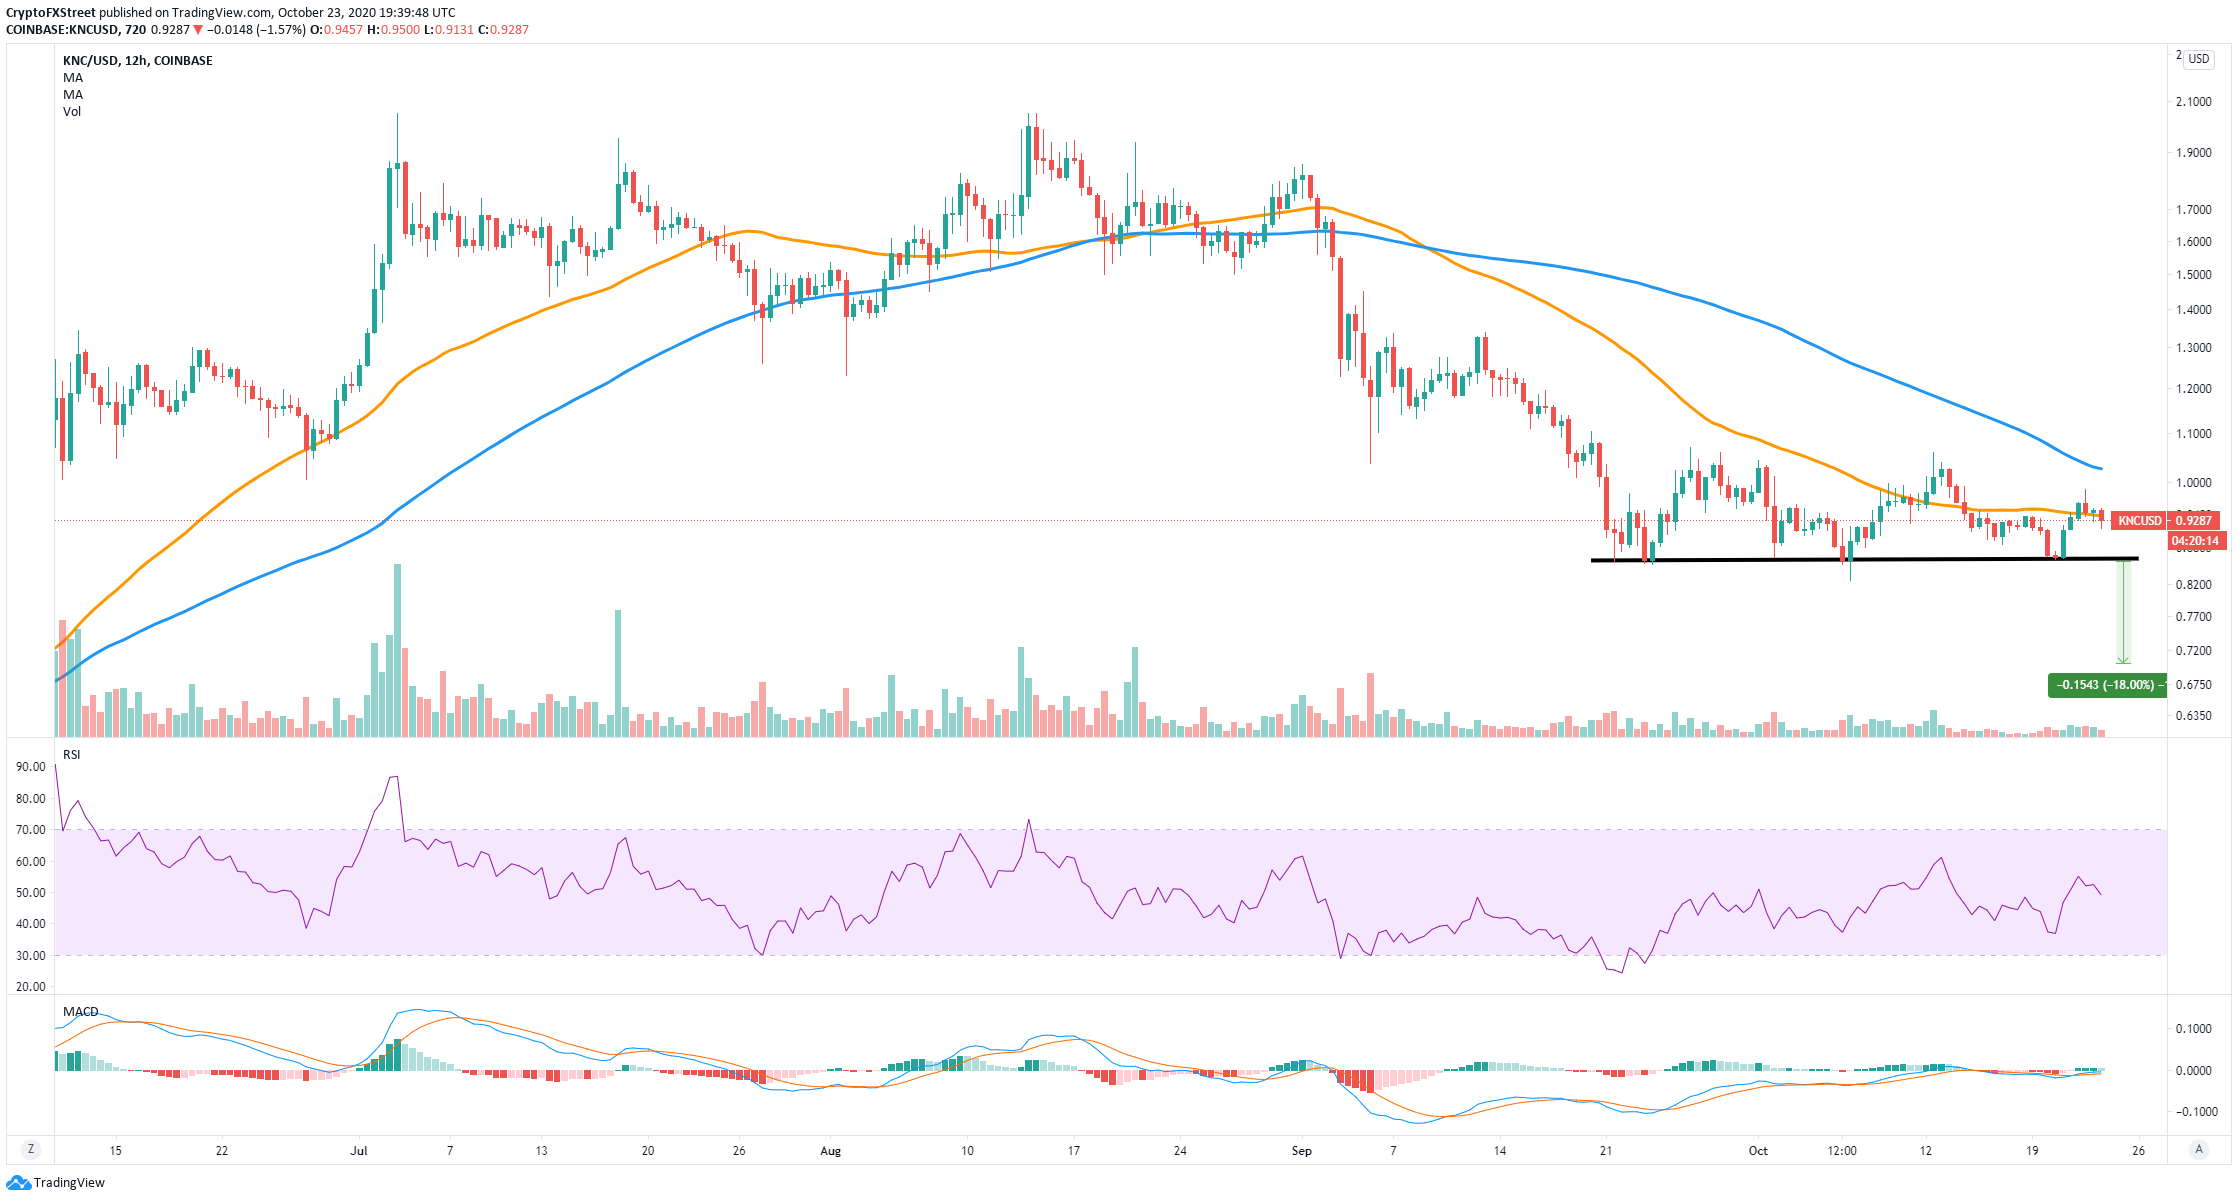
The bearish scenario for Kyber Network
On the 12-hour chart, it seems that bears could be taking over after the price slipped below the 50-SMA, possibly turning it into a resistance level. The MACD is also losing strength and close to a bear cross. The most important support level is established at $0.86, a breakout below this point can drive KNC to $0.7.
KNC/USD 12-hour chart
It’s also notable that the recent announcement of the new KyberPRO services for market making on DeFi projects has not positively affected the price of KNC. This could be another bearish indicator in the short-term.