Bitcoin price leaves another massive CME gap behind, technicals suggest it will be filled soon
![]()
- Bitcoin price is going through a recovery period after a quick dip to $16,188.
- Due to the extreme volatility in the past three days, Bitcoin has left another CME gap open.
Bitcoin is currently trading at $19,200 after a significant recovery from its low of $16,188. It seems that the flagship cryptocurrency is on its way to hit a new all-time high again. However, a notable gap on CME Bitcoin Futures might pose a threat for the bulls in the short term.
Bitcoin tends to fill CME gaps
The reliability of CME gaps being filled is good. In the past, the digital asset formed several notable gaps in October 2019, March 2020 and July 2020. All of them were filled, although the last one established on July 23, 2020, at around $9,500, was only partially filled on September 8 as Bitcoin price reached $9,850.
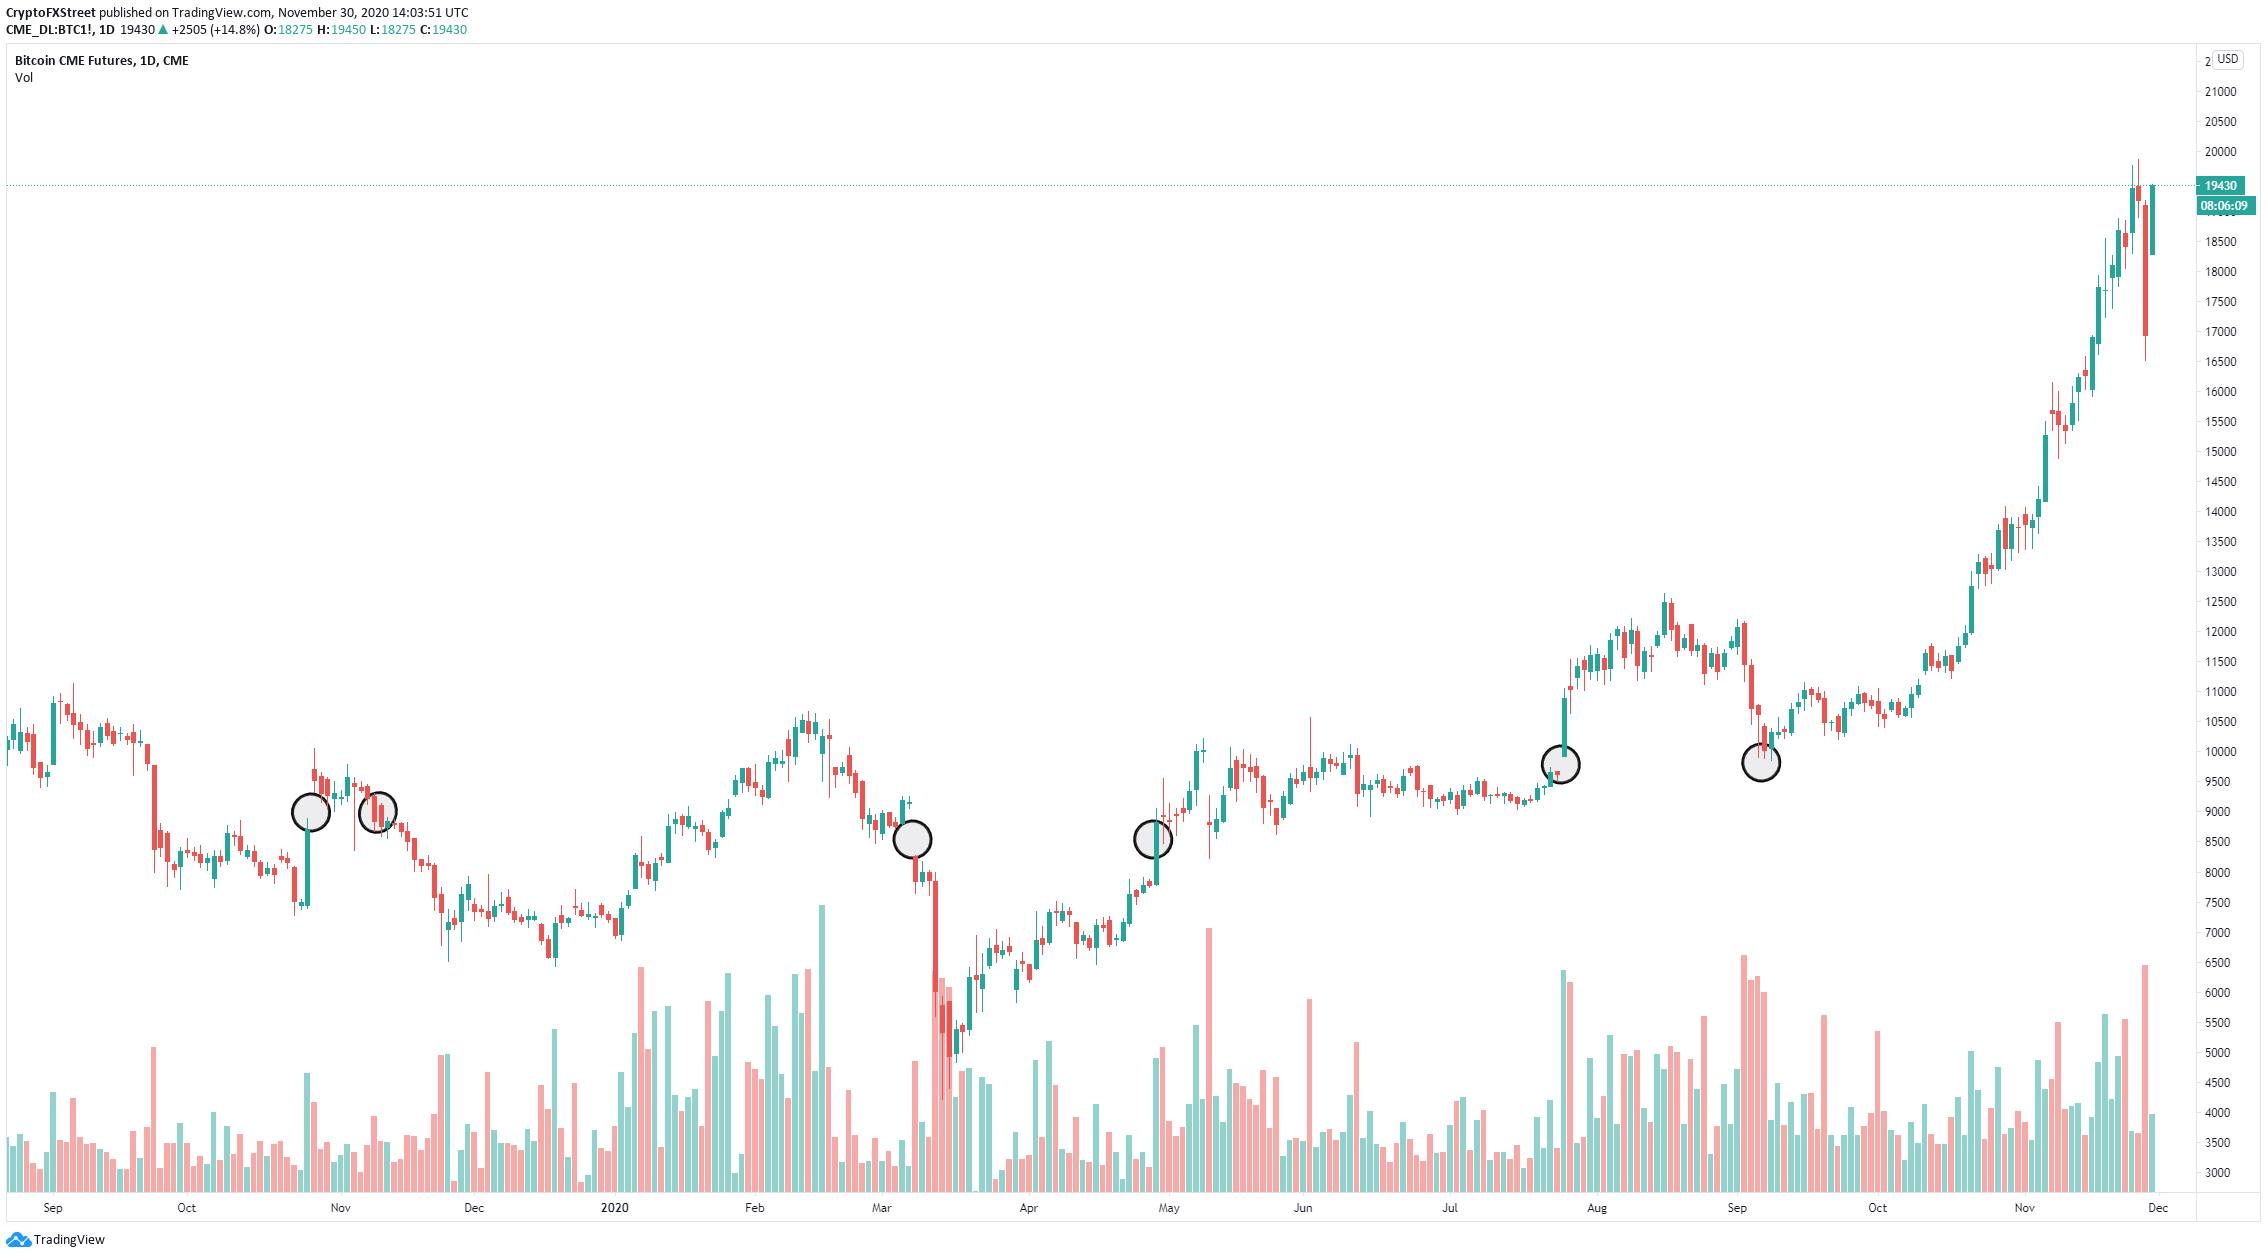
CME Bitcoin gaps chart
Either way, these gaps seem incredibly accurate, which means the latest gap formed between $17,295 and $18,275 is most likely bound to be filled. However, it’s important to note that most of the other gaps have taken several weeks and even months to fill eventually, which means we might not see this last gap fill until a few weeks later.
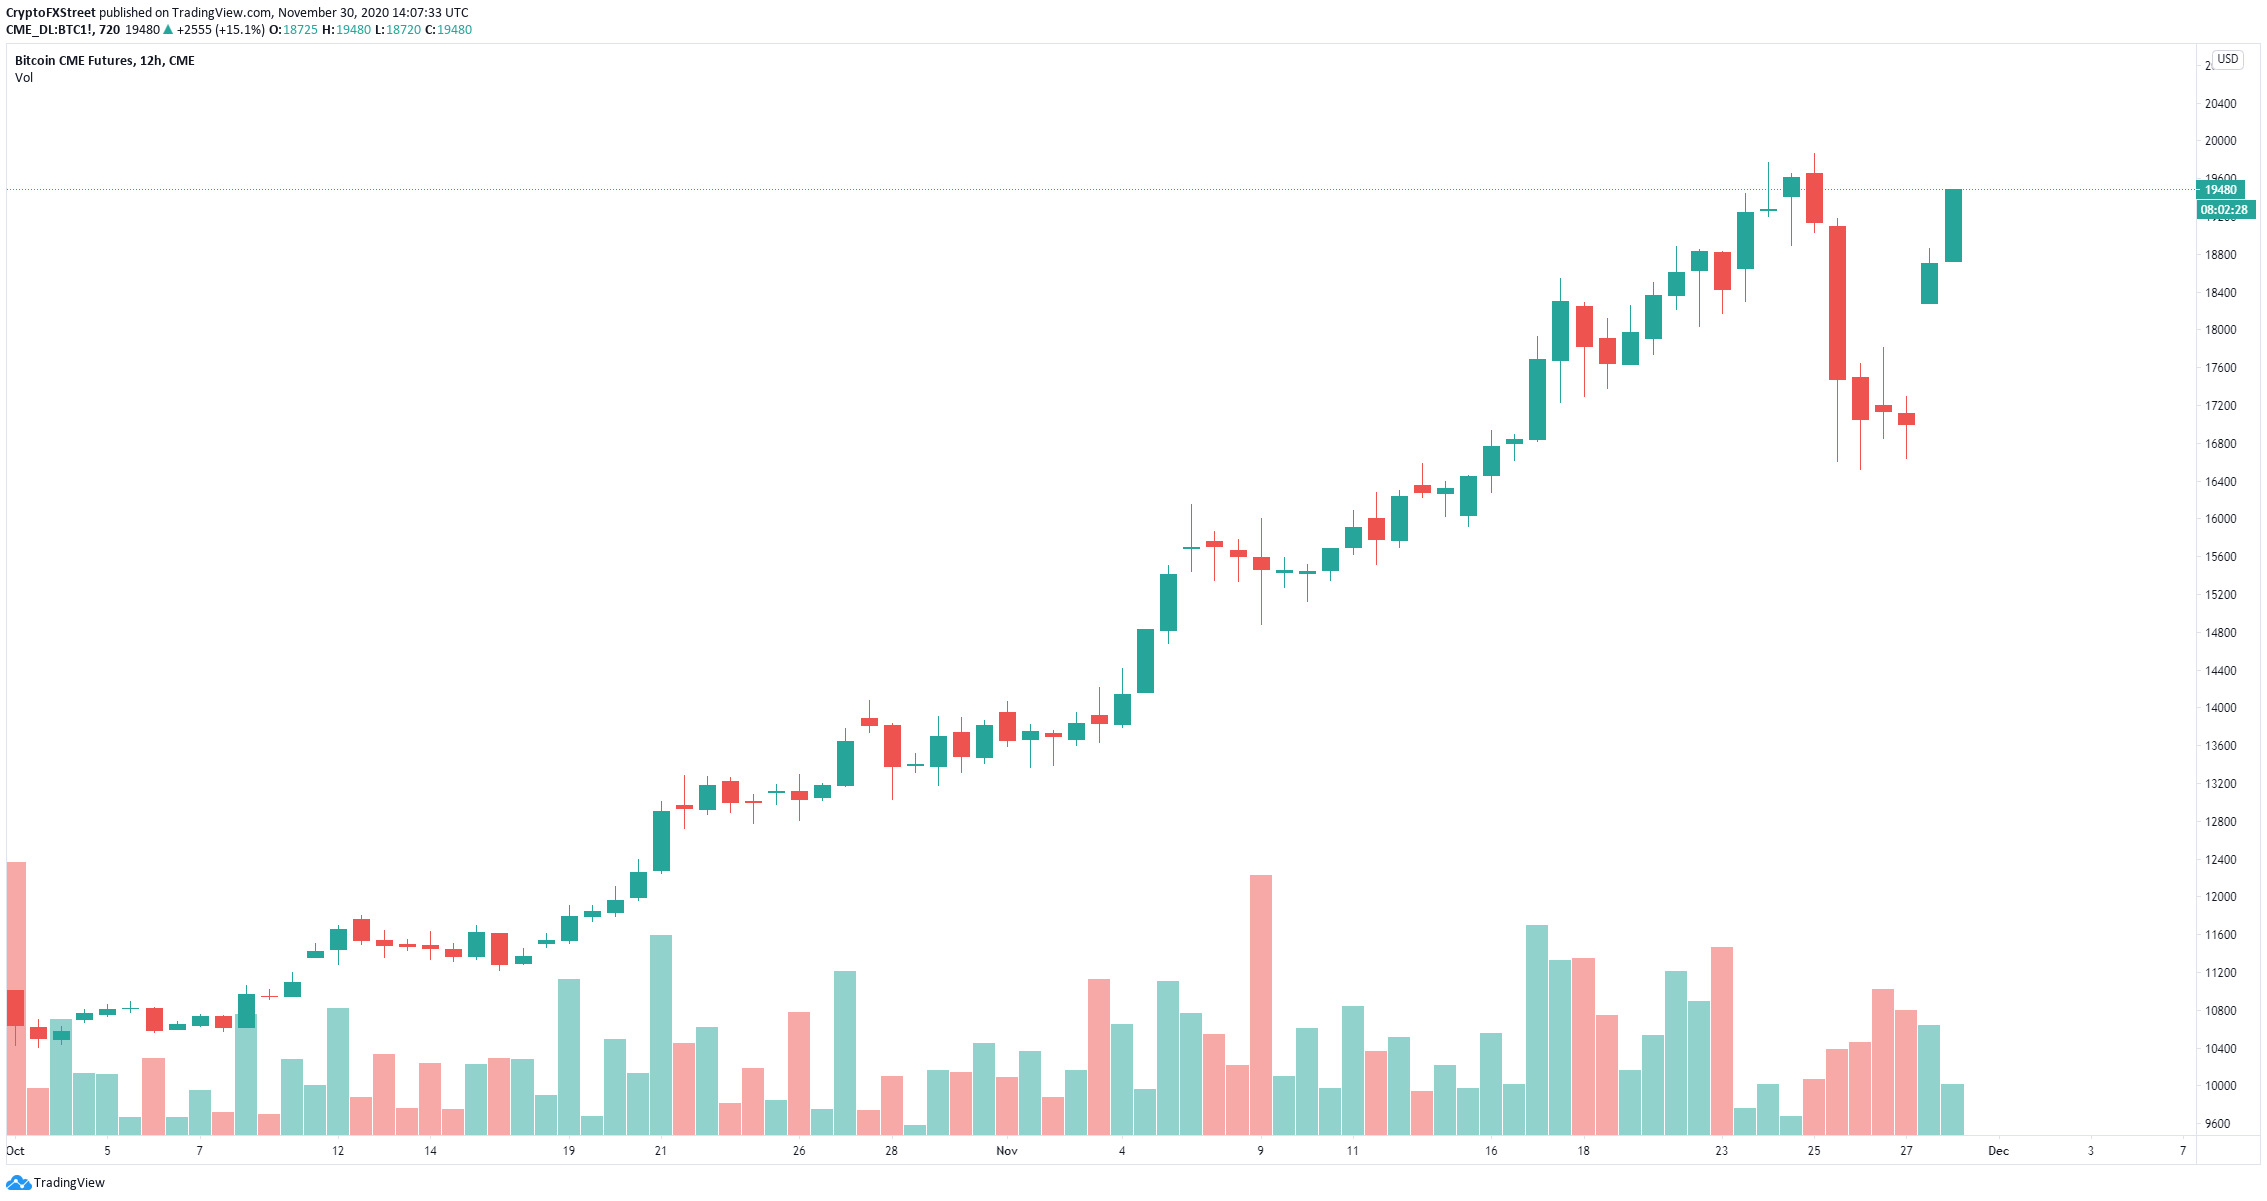
Bitcoin CME Futures 12-hour chart
Bitcoin price is up by around 10% during the weekend, leaving a massive gap on the 12-hour chart. Although gaps don’t necessarily always fill, several other bearish indicators show BTC is poised for a correction again.
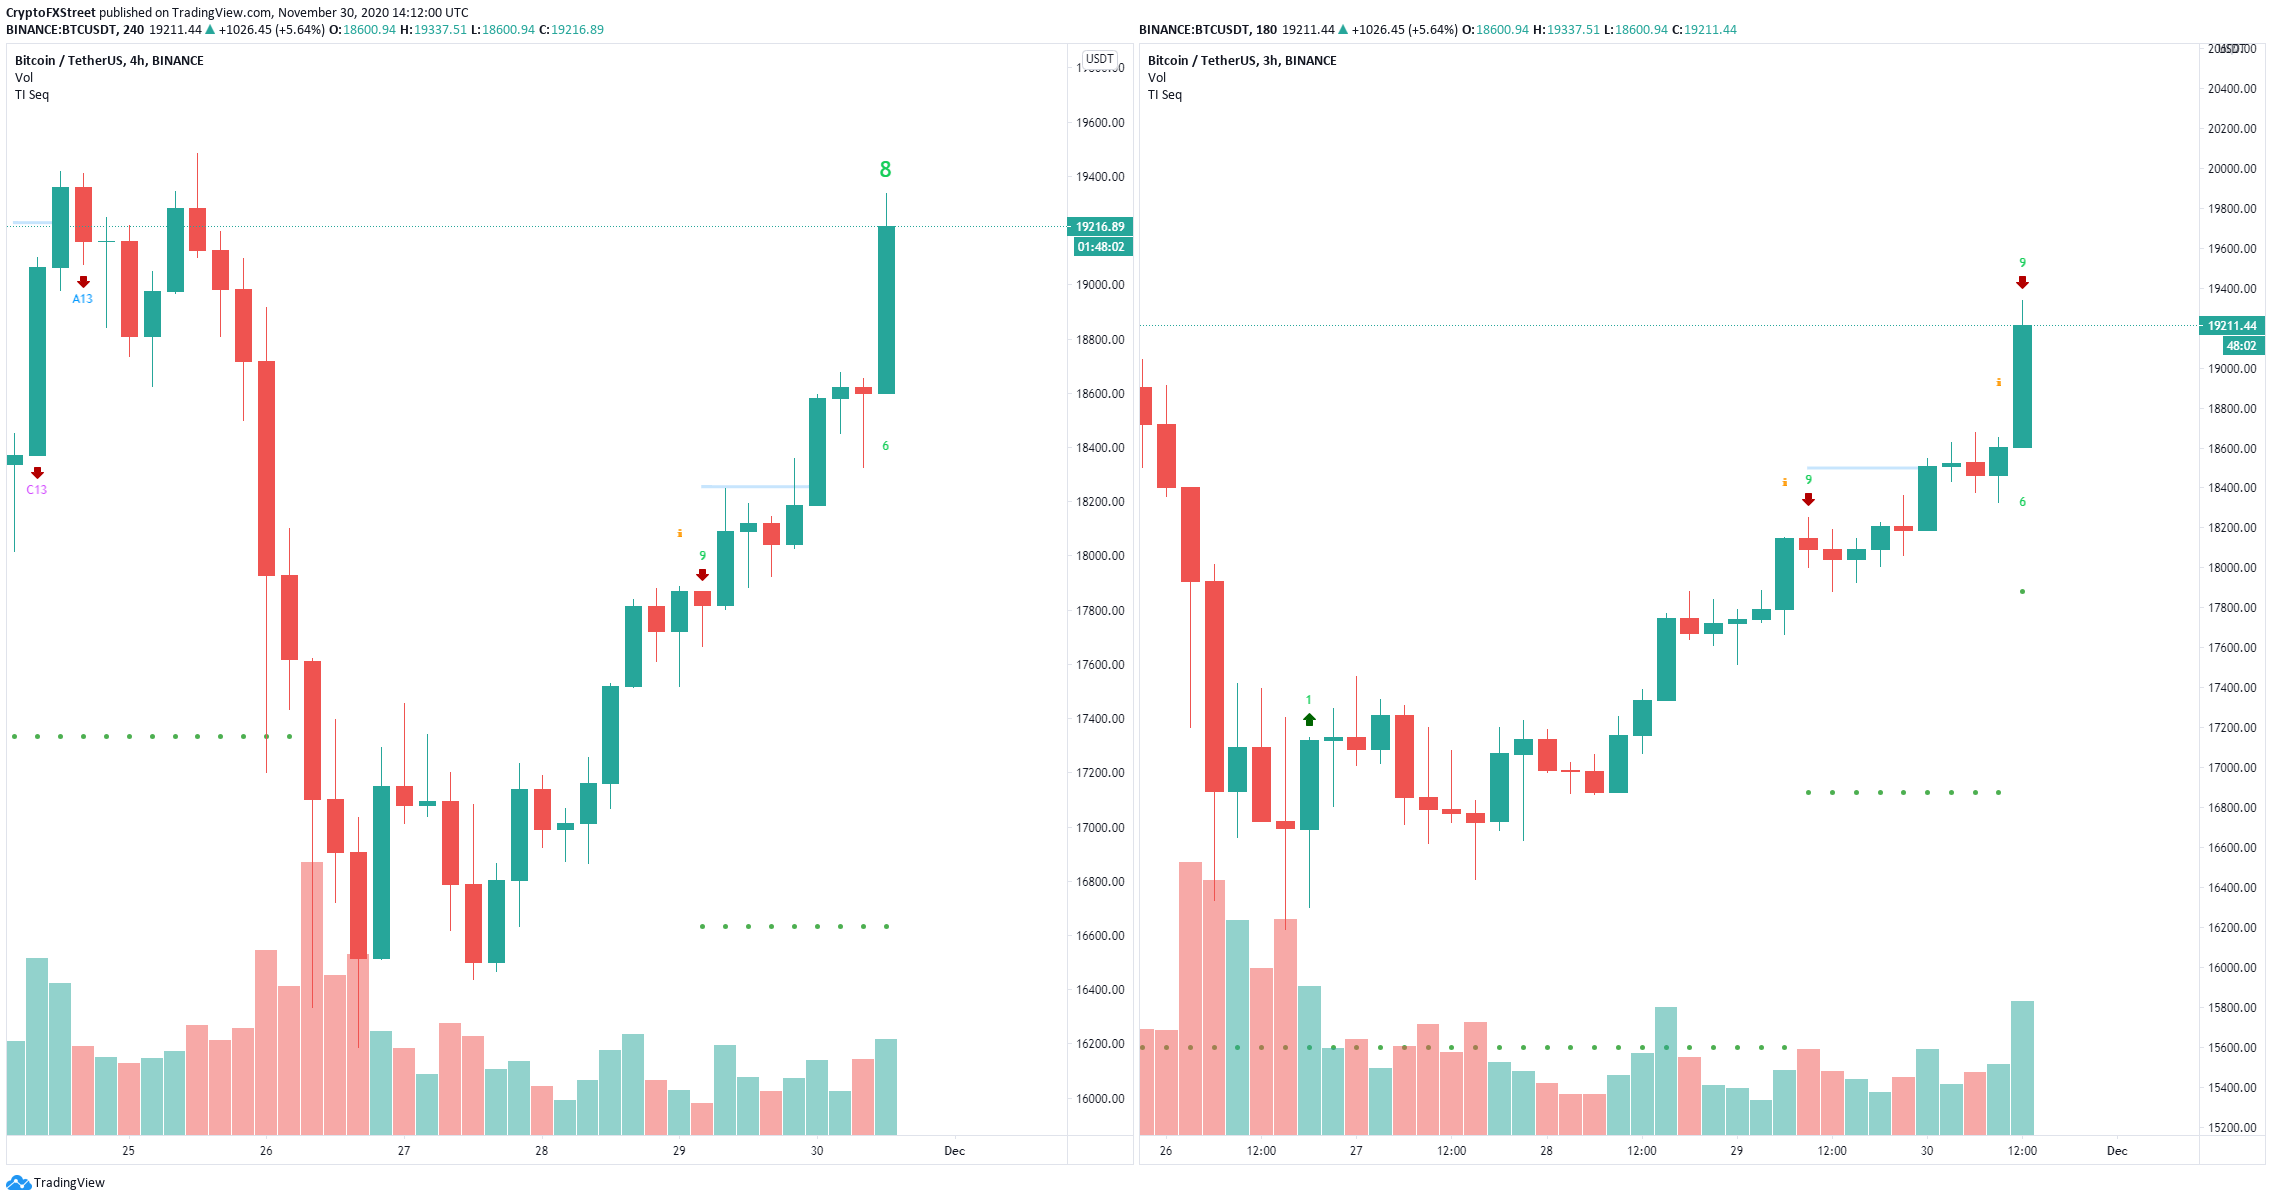
BTC/USD 3-hours and 4-hours charts
The TD Sequential indicator has presented a sell signal on the 3-hour chart, and it’s on the verge of posting another sell signal on the 4-hour chart, which suggests Bitcoin price could be bound for a short-term correction, potentially to fill the CME gap.
Nonetheless, Michael Sonnenshein, Managing Director of Grayscale, the largest Bitcoin trust fund globally, has stated that BTC remains bullish and the trust fund is “just getting started” based on the type of investors it is receiving in the past few months.