Oil Technical Analysis: The WTI bull trend is intact
![]()
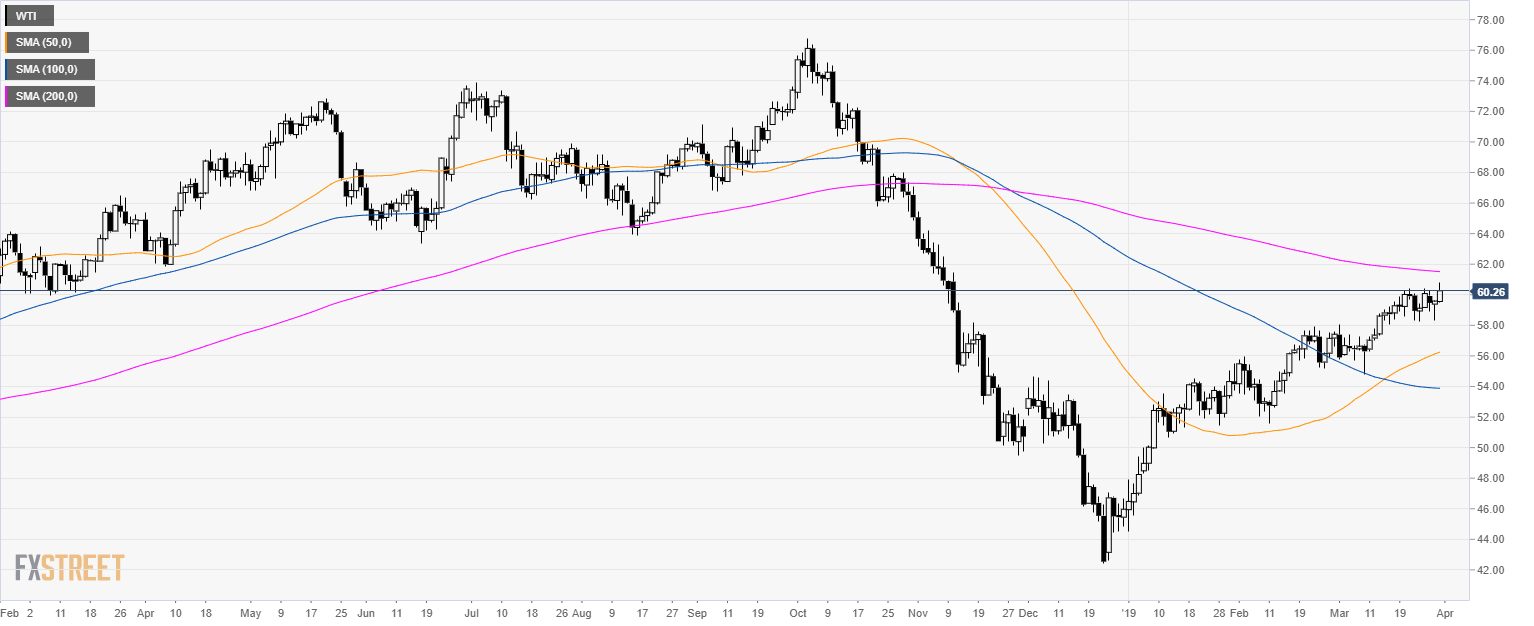
Oil daily chart
- Oil is trading above the 50 and 100-day simple moving averages (SMAs) suggesting a bullish bias.
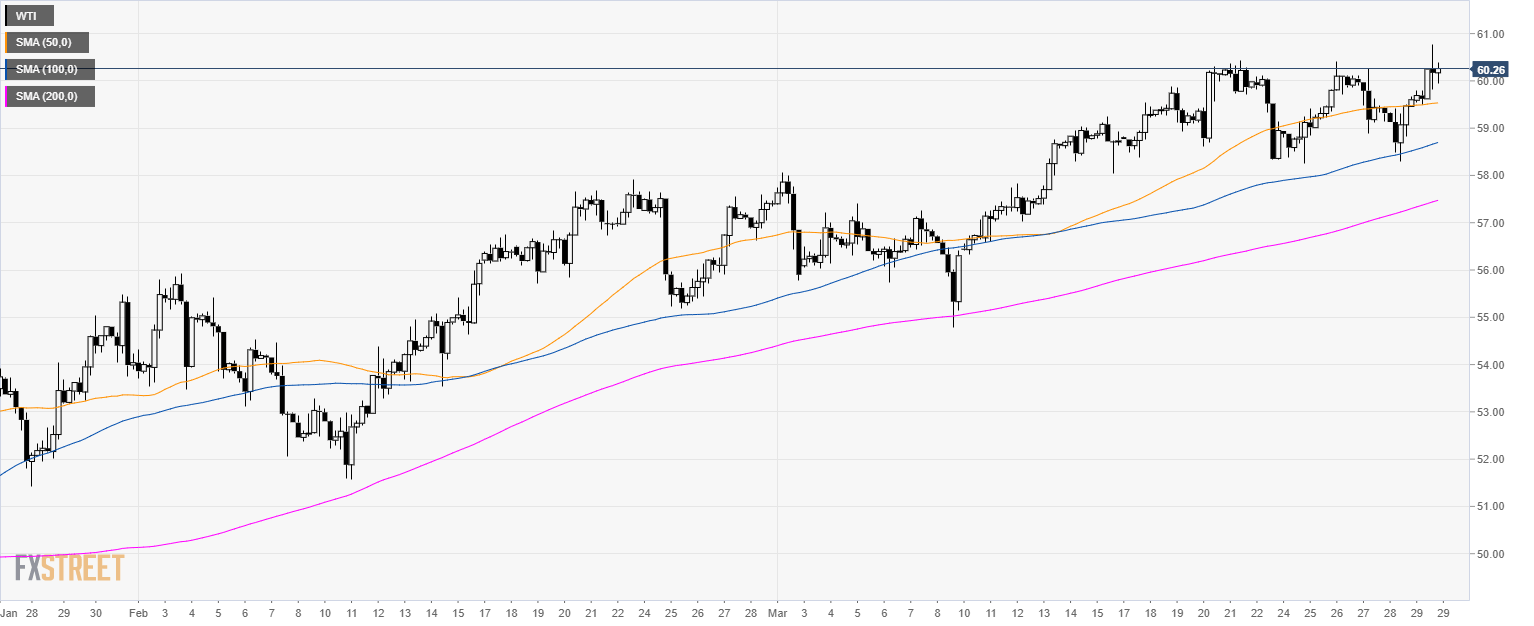
Oil 4-hour chart
- Crude oil WTI is trading above its main SMAs suggesting a bullish bias in the medium-term.
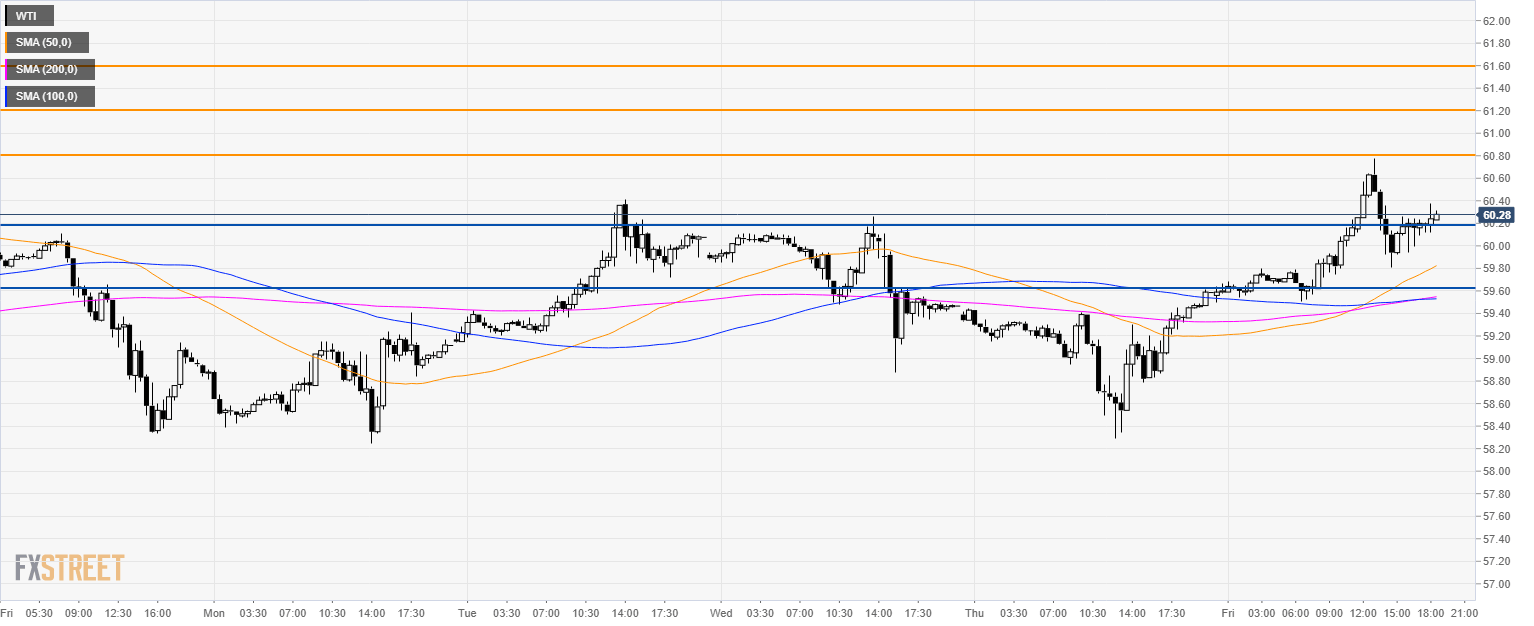
Oil 30-minute chart
- Bulls are looking for a break beyond $60.80 a barrel. The next resistances are seen at 61.20 and 61.60 level.
- Support is at 60.20 and 59.60 level.
Additional key levels