EUR/JPY Price Analysis: Double bottom at risk below 143.60s
![]()
- The EUR/JPY struggled at 144.00 and dived toward the 143.70s area.
- An EUR/JPY fall below 143.50, and the 20/50-day EMAs, could be tested before Friday’s session.
- EUR/JPY buyers reclaiming 144.00, and a new YTD high could be possible, above 145.56.
The EUR/JPY reached a weekly high at 144.09, but as the Asian session began, it retreated under 144.00. Although the EUR/JPY double bottom is still in play, it is at the brisk of being invalidated once the pair drops below the March 22 daily high at 143.62. At the time of writing, the EUR/JPY is trading at 143.75, registering minuscule losses of 0.01%.
EUR/JPY Price Action
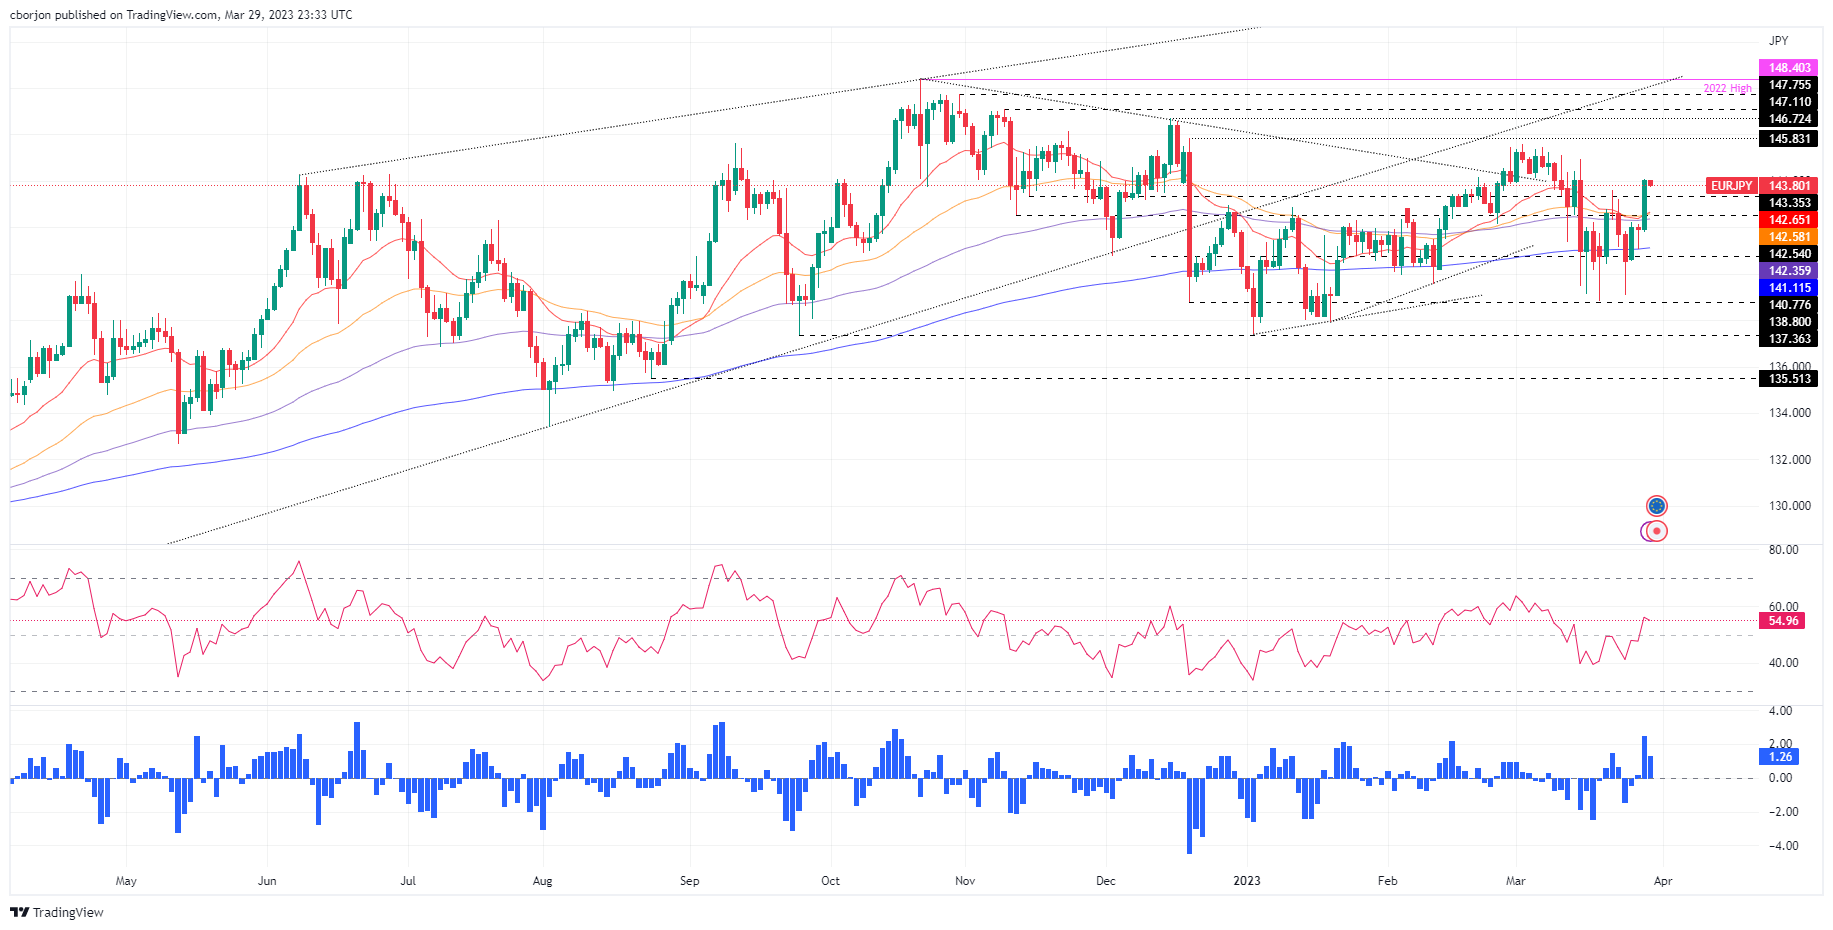
From the daily chart perspective, the EUR/JPY rallied sharply on Wednesday, piercing the 20 and the 50-day Exponential Moving Averages (EMAs), each at 142.65 and 142.58, respectively. However, failure to hold to its gains above 144.00 could exacerbate a pullback toward the 142.00 area.
Oscillators like the Relative Strength Index (RSI) and the Rate of Change (RoC), portray the pair might be headed for a bullish continuation. But the RSI’s slope shifted flat, suggesting buyers are getting a respite.
If the EUR/JPY buyers reclaim 144.00, that could open the door to test the March 15 high at 144.96, ahead of piercing 145.00. A breach of the latter, and the EUR/JPY could be trading at new YTD highs, nearby the December 15 high at 146.72. But firstly, the EUR/JPY needs to face solid resistance at 145.50 and 146.00.
On the other hand, if the EUR/JPY extended its losses below 143, the 20-day EMA, at 142.64, could be tested. Break below, and the 50-day EMA is next at 142.58.
EUR/JPY Daily Chart