Elrond Price Forecast: EGLD breaks all-time highs, but technicals spell trouble
![]()
- Elrond price hit a new all-time high at $245.8 on April 12.
- The digital asset is poised for a correction in the short term, according to a key indicator.
- EGLD has reached a $4 billion market capitalization and now ranked 37th.
Elrond has benefited from an impressive run since the beginning of April, gaining 77% to reach a new all-time high of $245.8. After this huge rally, the digital asset seems bound for a short-term correction.
Elrond price faces selling pressure in the near term
On the 4-hour chart, the Relative Strength Index (RSI) and Elrond price have formed what is known as a bearish divergence. In this case, the price has formed several higher highs while the RSI established a triple top.
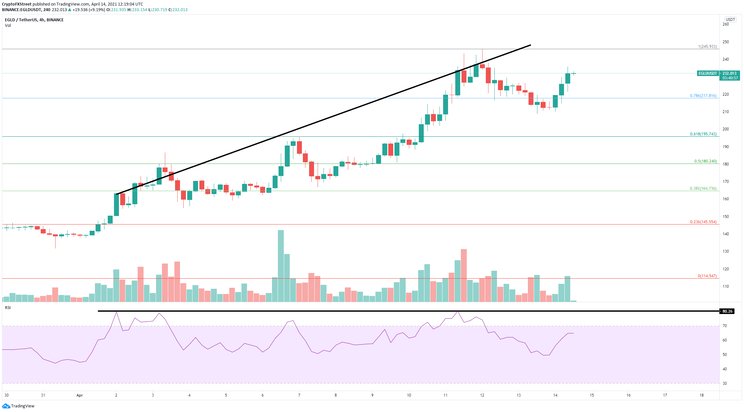
EGLD/USD 4-hour chart
Although this is a bearish divergence, it is most indicative of stagnation, which means bulls and bears are not becoming stronger or weaker. The nearest bearish price target is the 78.6% Fibonacci retracement level at $217.81. If this level is lost, bears will target $195.7 at the 61.8% Fib level.
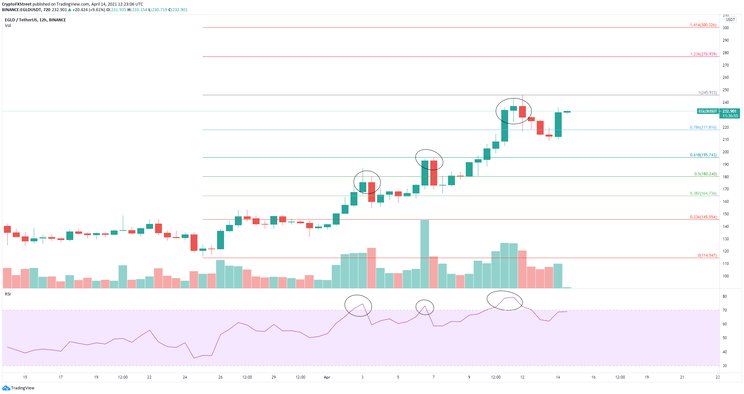
EGLD/USD 12-hour chart
Additionally, the RSI is also on the verge of overextension on the 12-hour chart. In April, every time this indicator passed above 70, the digital asset had a significant correction, which adds credence to the outlook above.
On the other hand, to invalidate the bearish outlook, bulls only need to push EGLD toward the previous all-time high as they face practically no resistance ahead. A breakout above $245.8 will take Elrond price toward $277 at the 123.6% Fibonacci level.