Gold Price Forecast: XAU/USD bulls eye $1,855, strong support at $1,841 – Confluence Detector
![]()
Gold is shining once again – not only providing much-needed volatility for traders but also moving up. After an initial attack on $1,850, XAU/USD retreated. The precious metal seems to be looking for a direction.
How is gold positioned on the technical chart?
Gold Price: Key levels to watch
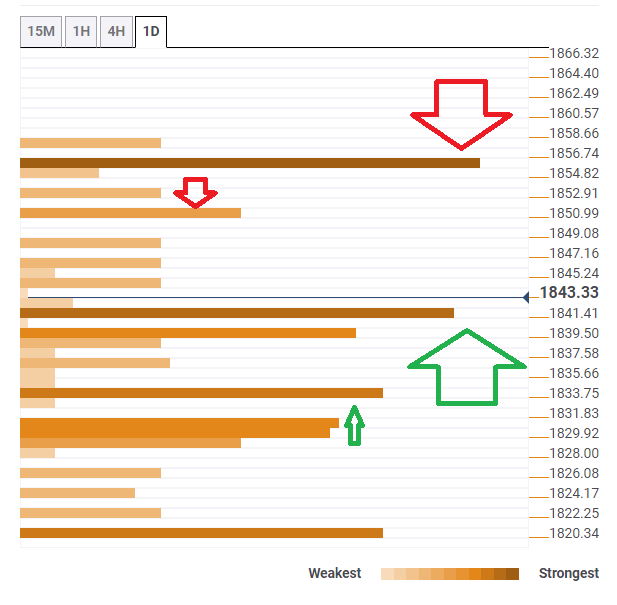
The Technical Confluences Detector is showing that XAU/USD faces some resistance at $1855, which is where the Pivot Point one-week Resistance 2 and the previous daily high converge.
A critical cap is $1,855, which is a juncture including the all-important Fibonacci 161.8% one-day and the PP one-month R1.
Looking down, gold has support at $1,841, which is the convergence of the Fibonacci 38.2% one day, the Simple Moving Average 5-15m, and the Bollinger Band one-day Upper.
Another cushion awaits at $1,833, which is the meeting of the PP one-day S1, the PP one-week R1, and the BB 1h-Lower.
XAU/USD Confluence levels
About Technical Confluences Detector
The TCD (Technical Confluences Detector) is a tool to locate and point out those price levels where there is a congestion of indicators, moving averages, Fibonacci levels, Pivot Points, etc. If you are a short-term trader, you will find entry points for counter-trend strategies and hunt a few points at a time. If you are a medium-to-long-term trader, this tool will allow you to know in advance the price levels where a medium-to-long-term trend may stop and rest, where to unwind positions, or where to increase your position size.