Top 3 Price Prediction Bitcoin, Ethereum, Ripple: A conservative take on a bullish market
![]()
- Bitcoin price remains in an uptrend but faces shorter resistance near $25,000.
- Ethereum price shows promise after tagging $1,700 earlier in the week.
- Xrp price still shows potential for a spike tour 0.44 in the short term.
The crypto market has seen a lull in activity after making gains earlier in the week. Despite the slowing trend, the outlook remains mildly bullish for Bitcoin, Ethereum, and Ripple.
Bitcoin price making steady gains
Bitcoin price has been on a steady upward trajectory since the start of the year, and, despite some short-lived dips, the peer-to-peer digital currency continues to show promise.
Bitcoin price currently trades at $23,165, down 0.5% on the day. The trend remains bullish as the bears have yet to produce a settling price beneath the 8-day exponential moving average (EMA). The Binance exchange API suggests the bulls remain in control, with a strong candle from January 12 and an influx of $454,000 transactions.
The next bullish target remains near the mid-$24,000 zone, which could result in a 6% increase from the current Bitcoin price.

BTC/USDT 1-Day Chart
Traders should be on the lookout for the $23,000 zone, as a breach below this level could result in a sell-off toward previous resistance zones near $21,000. The Bitcoin price would result in an 8% decline under the bearish scenario.
Ethereum price still pointing higher
Ethereum price reached a new high for the year at $1,714 earlier in the week, but profit-taking has since occurred. Despite some bearish influence, the overall trend remains intact.
Ethereum is currently trading at $1,666, hovering above the 8-day EMA and 21-day SMA, which signals a healthy uptrend. The lack of momentum calls for caution as bullish traders await more volatility.
The volume indicator is also in the bulls’ favor, but the market remains at a standstill as traders monitor key levels for potential sell-offs. The $1,610 zone remains crucial for Ethereum’s uptrend, and a failure to hold above this level could trigger a deeper decline.
The next bullish target for Ethereum remains near the mid-$1,800 liquidity zone, which could result in a 12% increase from the current Ethereum price.
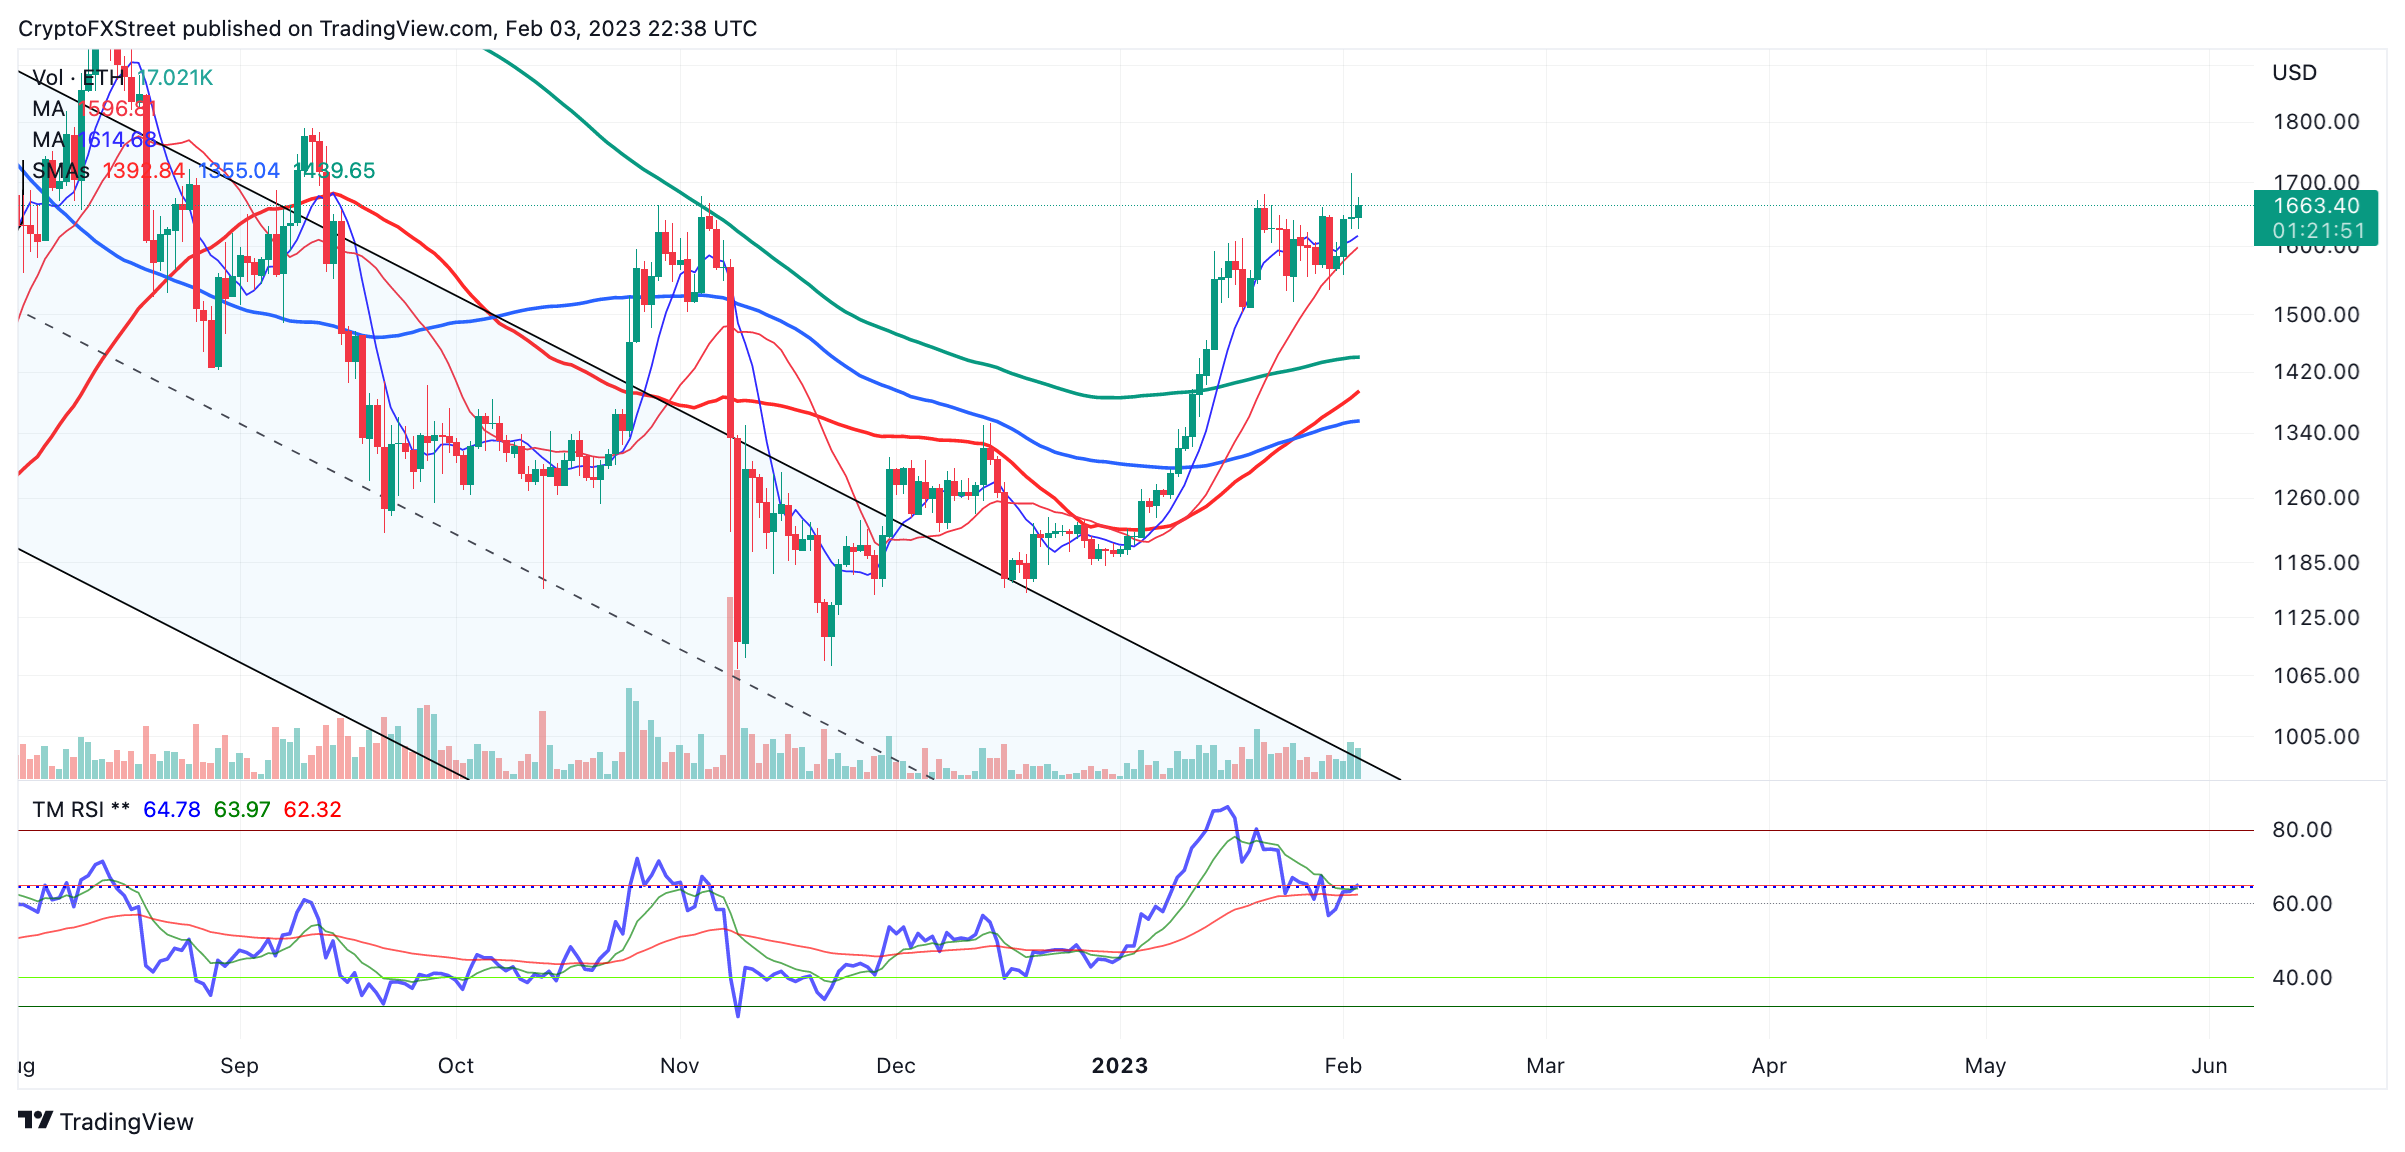
ETH/USDT 1-Day Chart
Invalidation of the bullish forecast targeting $1,850 could occur from a breach below $1,610, resulting in further sell-offs and a potential decline of 18% from Ethereum’s current market value.
XRP price undecided but the uptrend prevails
XRP price has seen limited movements this week, with back-and-forth price action taking place within the $0.40 zone. Despite this sluggishness, key indicators suggest a positive outlook for the digital remittance token. The 21-day simple moving average (SMA) continues to provide support. A Fibonacci retracement analysis of the winter rally shows that the current price represents a correction rather than a significant reversal.
XRP price is currently trading at $0.411. The recent pivot point at $0.381 on January 31 landed at the 38.2 retracement level, a common stopping ground for consolidations during strong uptrend rallies. So long as XRP stays above the halfway point near $0.361, the potential for a larger macro upswing lingers.
A conservative approach would be to target the $0.44 liquidity zone as the next pitstop for the uptrend, resulting in a 10% increase from XRP’s current market value.
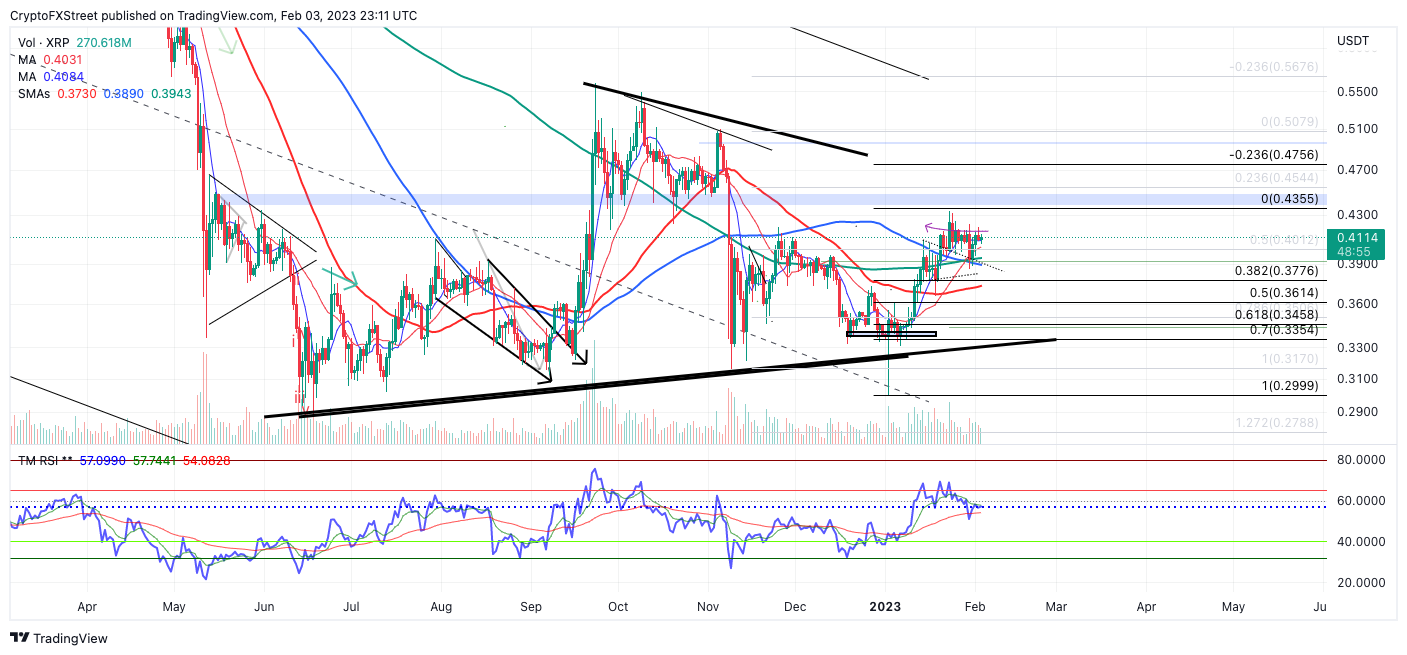
XRP/USDT 1-Day Chart
Traders looking to join the trend could place an invalidation point below the recent swing low at 0.381. A breach of the barrier would likely Induce the 50% retracement into the 0.361 Zone, resulting in a 12% decrease from Ripple’s price today.