Wednesday 13th November: Technical analysis and review.

Key risk events today:
UK CPI y/y; UK Core CPI y/y; UK HPI y/y; UK PPI Input m/m; UK PPI Output m/m; UK RPI y/y; US CPI m/m and Core CPI m/m; Fed Chair Powell Testifies; RBNZ Gov Orr Speaks; RBA Assist Gov Bullock Speaks.
EUR/USD:
Tuesday had Europe’s single currency navigating lower ground vs. the buck, consequently erasing Monday’s gains and chalking up a low of 1.1002. EUR/USD shrugged off better-than-expected German ZEW Economic Sentiment, posting minus 2.1 points, vs. expected -13.2.
New York – (Reuters) President Donald Trump also stated on Tuesday the United States is close to signing a ‘phase one’ trade deal with China, adding in a speech to the Economic Club of New York he will only accept a deal if it is good for his country and US workers.
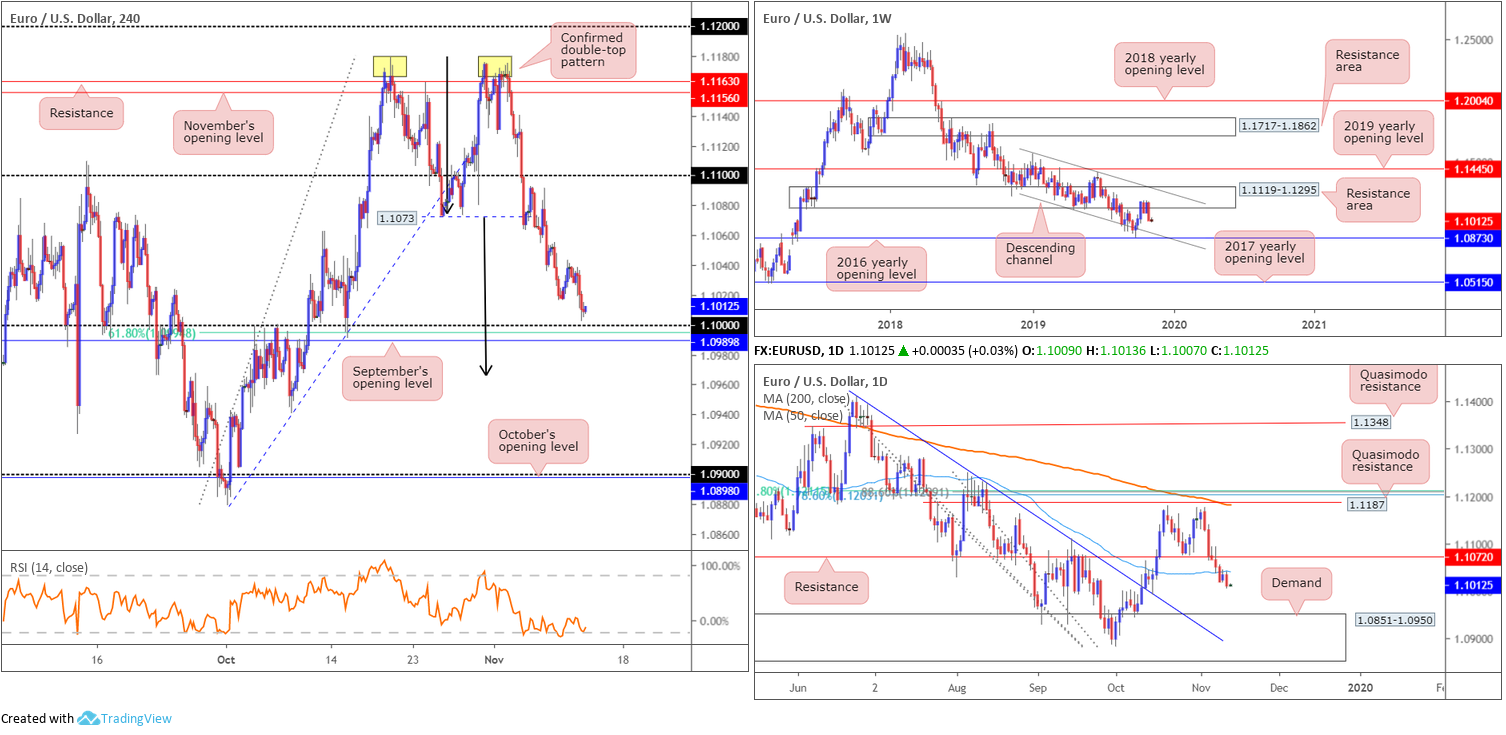
Following on from Tuesday’s technical research, chart studies show a distinct double-top pattern formed (peaks plotted at 1.1179/1.1175) after breaking the 1.1073 October 24 low (the confirmation point) on November 5. Some technicians would label the peaks as an ‘eve and eve’ formation, considered to be a higher-probability pattern. The next downside target on this scale can be seen at the 1.10 handle, sited close by September’s opening level at 1.0989 and a 61.8% Fibonacci retracement ratio at 1.0994. The double-top’s take-profit target is set beneath this value at 1.0965 (black arrows – measured by taking the value from the tallest peak and adding this to the breakout point).
Weekly flow, also highlighted in Tuesday’s research, has sellers marching south from the underside of a long-standing resistance area drawn from 1.1119-1.1295, recording its worst weekly decline since August last week. Increased selling has the lower boundary of a descending channel to target (extended from the low 1.1109), set a few points north of the 2016 yearly opening level at 1.0873. Concerning trend direction, the primary downtrend has been in motion since topping in early 2018 at 1.2555.
Daily research had the pair turn lower from the underside of its 50-day SMA (blue – 1.1040) yesterday, setting the stage for a potential run towards demand at 1.0851-1.0950 – houses the 2016 yearly opening level mentioned above on the weekly timeframe at 1.0873.
Areas of consideration:
Outlook unchanged.
Traders short the H4 double top pattern have likely reduced risk to breakeven and are close to liquidating a portion of the position. The initial take-profit target, as underscored above, is set around the key figure 1.10. Considering its local confluence (sited close by September’s opening level at 1.0989 and a 61.8% Fibonacci retracement ratio at 1.0994), active buying is expected from here. However, with higher-timeframe structure suggesting a move to as low as the top edge of daily demand plotted at 1.0950 this week, which happens to converge closely with the H4 double-top’s take-profit target, it’s unlikely the buying will be anything to get excited about.
GBP/USD:
Despite kicking off the week strongly, GBP/USD movement entered a reasonably narrow consolidation Tuesday, between 1.2873/1.2815. On the data front, unemployment in the UK ticked lower by 3.8% vs. 3.9%, while average earnings reported a 3.6% decline vs. 3.7%, revised from 3.8%. US data was limited, though US President Donald Trump, in a speech to the Economic Club of New York, did state the US were close to signing a ‘phase one’ trade deal with China.
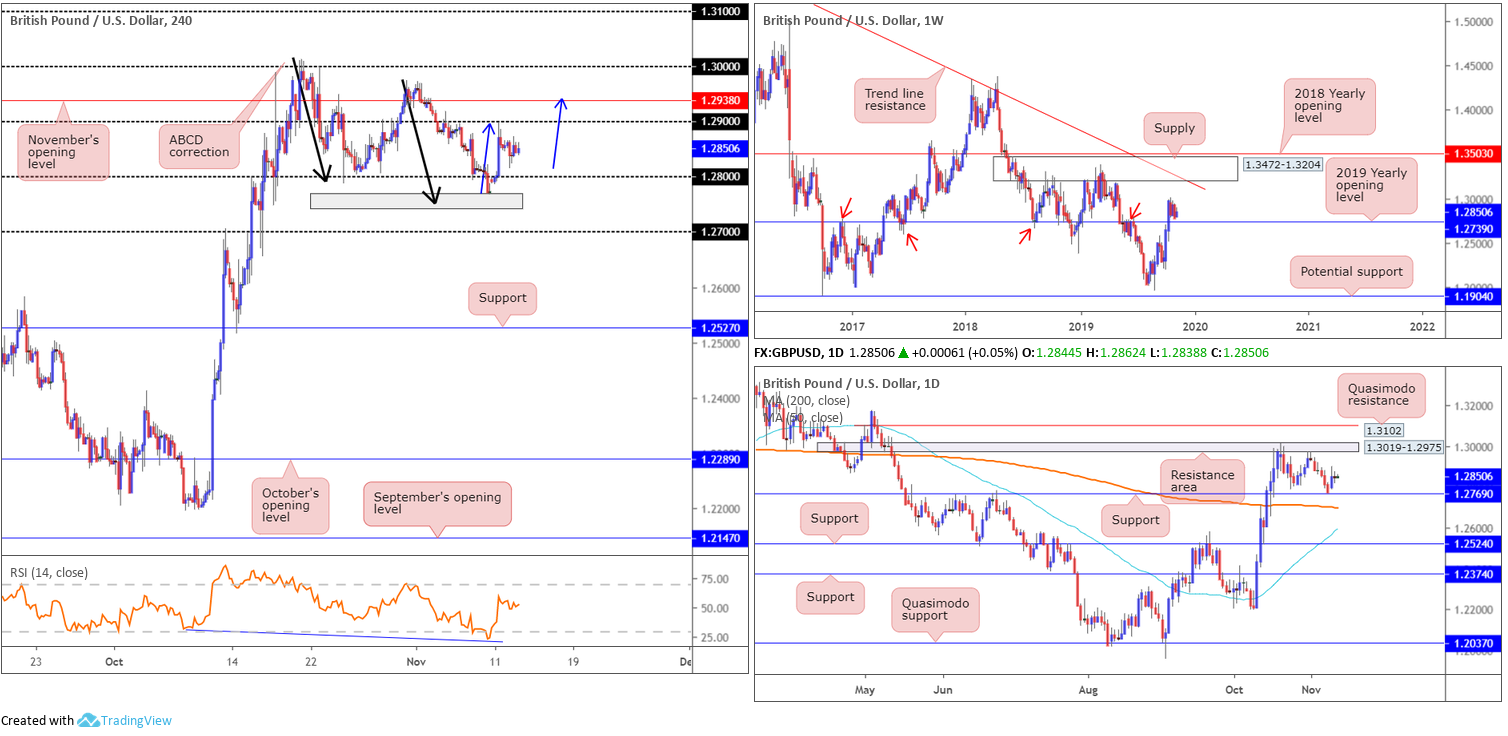
Technically, the H4 candles remain hovering mid-range between 1.29/1.28, with another leg higher seen as a real possibility. Those who read Monday’s weekly technical briefing may recall the following piece:
Following a brief period of consolidation a few points north of 1.28, likely gathering buy orders, GBP/USD action swung lower and shook hands with an interesting area of support marked in grey. Made up of weekly support at 1.2739 and daily support coming in at 1.2769, as well as a H4 ABCD correction pattern taken from the high 1.3012 (black arrows) and RSI confirmation (hidden bullish divergence within oversold territory – blue line), this area is likely of interest for potential longs today/early this week. What’s also interesting is a number of sell stops were tripped on the break of 1.28, both from traders attempting to fade the figure and those short the breakout, thus potentially providing liquidity to buy.
A bounce from 1.2739/1.2769 followed up with a break back above 1.28 on a H4 closing basis could entice buyers into the market. A conservative entry on the close of the breakout candle is then an option, with protective stop-loss orders either plotted beneath 1.2739 or the lower shadow of the breakout candle.
Areas of consideration:
Outlook unchanged.
Traders who entered long above 1.28 on the back of the H4 closing candle at 1.2803 ended Monday with a smile. With risk reduced to breakeven and the majority of the position liquidated, traders are still, noting we have higher-timeframe supports in play, likely looking for additional gains.
An upside break of 1.29 today could draw in November’s opening level at 1.2938, followed closely by a daily resistance area at 1.3019-1.2975 and the key figure 1.30. As you can see, fresh longs above 1.29 may prove problematic. Therefore, bearish scenarios could be an option as we close in on 1.2975/1.30.
AUD/USD:
AUD/USD prices head into Wednesday’s Asia-Pac hours mostly unmoved.
On the trade front, US President Donald Trump, in a speech to the Economic Club of New York, did, however, state the US were close to signing a ‘phase one’ trade deal with China, though failed to offer details on when a signing could happen.
From a technical perspective, the unit’s position remains unchanged from previous reports (italics):
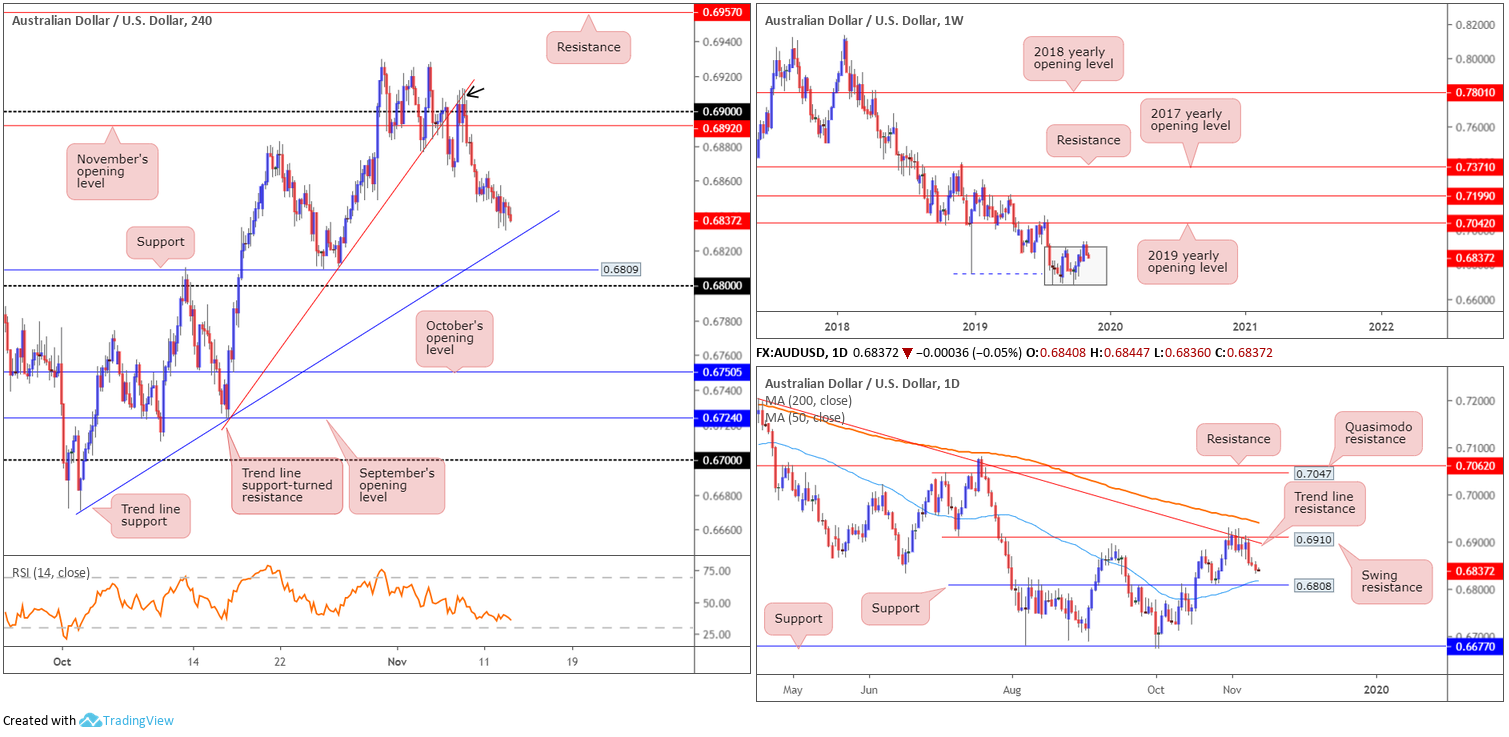
Recent activity on the weekly timeframe witnessed the AUD/USD deliver a two-candle fakeout to the top edge of a 3-month long consolidation zone between 0.6894/0.6677 (light grey). Although likely to encourage further selling over the coming weeks, resistance outside of the said range holds at the 2019 yearly opening level drawn from 0.7042, in the event we push higher. With a primary downtrend in play since early 2018, breaking higher is likely to be a challenge.
In conjunction with weekly analysis, daily swing resistance seen at 0.6910 – coupled with daily trend line resistance taken from the high 0.7393 – held price action lower last week. Further downside from this point will likely draw in daily support at 0.6808, aligning closely with the 50-day SMA (blue – 0.6817 [rising]). Note the 200-day SMA (orange – 0.6941) remains pointing south.
Areas of consideration:
Traders who sold short the market around 0.69/H4 trend line support-turned resistance (0.6723) – a noted move to watch for in previous writing – based on Friday’s H4 inside candle (black arrow) remain in healthy gains. The next downside target is seen close by in the form a H4 trend line support extended from the low 0.6670, closely shadowed by H4 support at 0.6809 and then 0.68. Furthermore, it may also be worth noting daily support resides at 0.6808 (essentially the same barrier as H4 support) along with a 50-day SMA (blue – 0.6817).
USD/JPY:
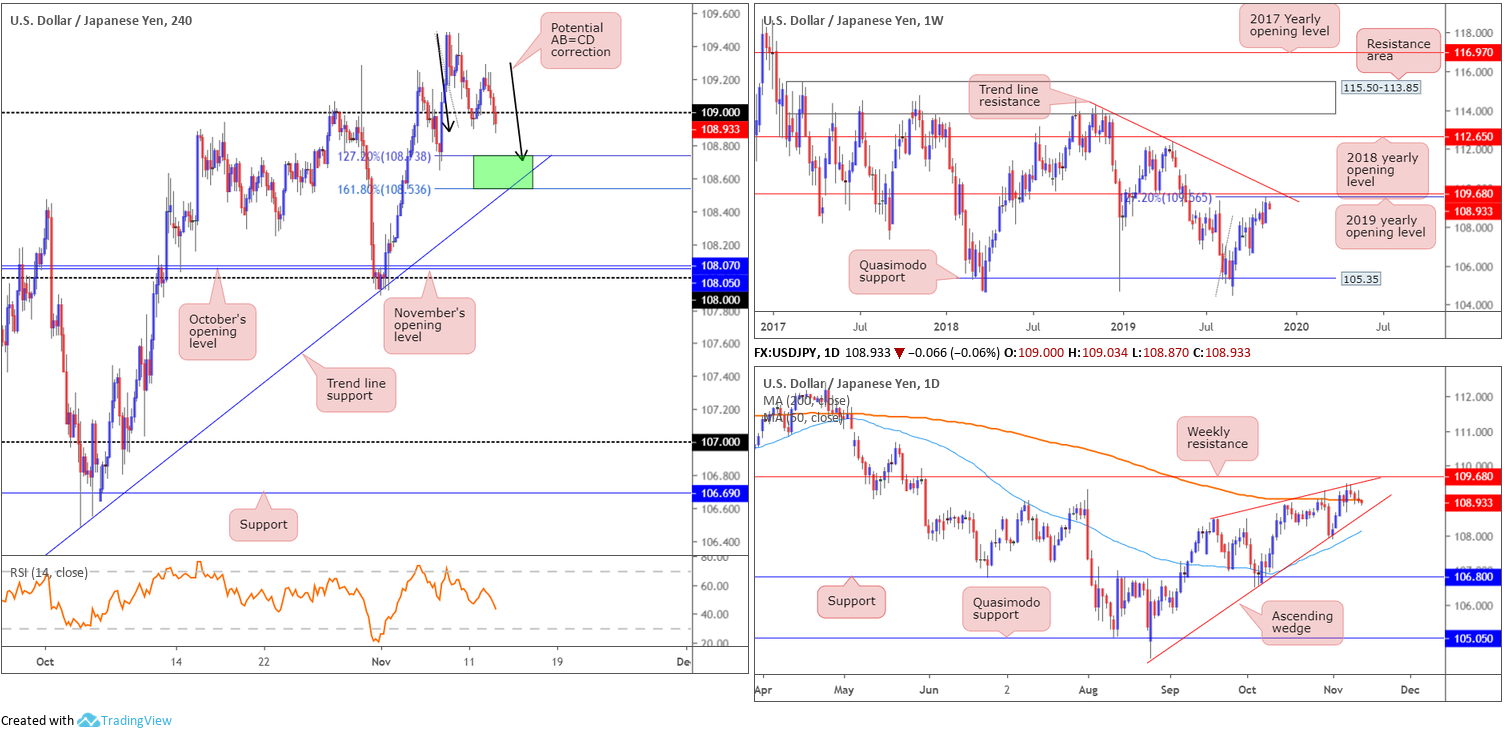
USD/JPY activity failed to sustain gains beyond 109.29 Tuesday, rotating south into European hours and concluding the day mostly unchanged. In recent hours, the H4 candles crossed beneath the 109 handle, eyeing a possible move towards a H4 AB=CD (black arrows) completion between the 161.8/127.2% Fibonacci extension points (green) at 108.53/108.73.
While H4 is gearing up for a possible bounce from 108.53/108.73, a wider perspective demonstrates strong resistance may be in store. Weekly movement shows resistance nearing in the form of the 2019 yearly opening level at 109.68 and a 127.2% Fibonacci ext. point at 109.56 (taken from the low 104.44). Also sited close by is trend line resistance extended from the high 114.23.
Activity on the daily timeframe remains entrenched within an ascending wedge formation (104.44/108.47 – red lines), though recently pushed beneath its 200-day SMA (orange – 109.01). Having noted weekly resistance plotted nearby at 109.68, and a daily ascending wedge formation unfolding since early September, the likelihood of a continuation north, long term that is, is unlikely.
Areas of consideration:
A bounce from 108.53/108.73 to at least 109 is certainly a possibility today. The danger, of course, comes with knowing the unit is trading close to resistance on the higher timeframes.
In the event we reclaim 109 back to the upside, however, and cross swords with H4 Quasimodo resistance at 109.74 (not visible on the screen), selling this market is then an option. Knowing the Quasimodo resistance boasts additional backing from weekly structure is certainly appealing.
USD/CAD:
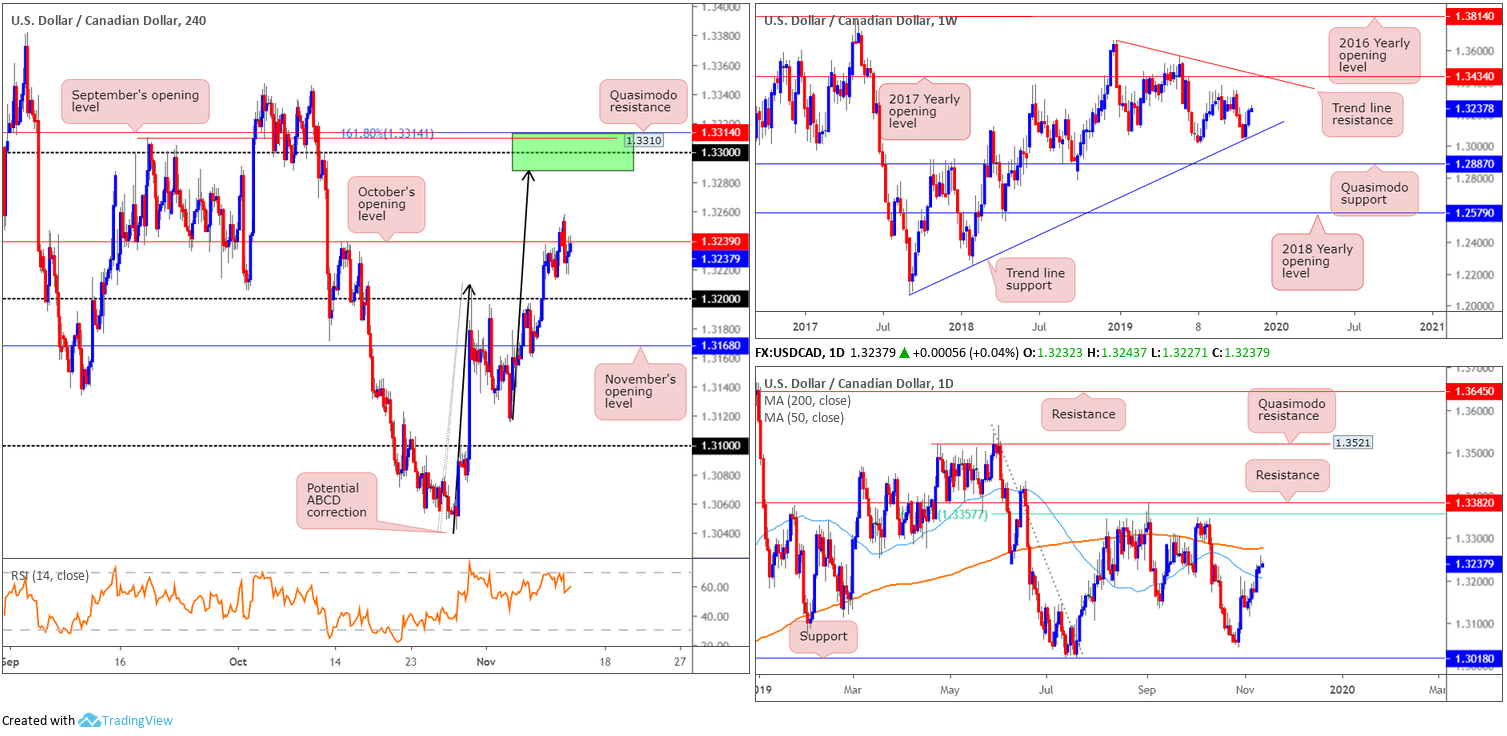
USD/CAD trade flow wrapped up Tuesday’s session unchanged, forming a reasonably clear-cut doji indecision candle on the daily timeframe. Price action, as you can see, remains sandwiched between the 50-day SMA (blue – 1.3205) and 200-day SMA (orange – 1.3275).
In terms of H4 price action, nonetheless, the candles remain stationed beneath October’s opening level at 1.3239, despite an earnest attempt to conquer this region yesterday. Should H4 price overthrow 1.3239, limited resistance is visible until reaching 1.33. Supporting 1.33 as a resistance area, we have a potential ABCD correction (black arrows) terminating at 1.3287, a 161.8% Fibonacci ext. point at 1.3314, Quasimodo resistance at 1.3310 and September’s opening level at 1.3314 (green). In addition, the 200-day SMA is seen lurking just south of this zone.
Technical research on the weekly timeframe continues to exhibit a bullish presence as buyers extended the recovery off trend line support (taken from the low 1.2061) in reasonably strong fashion last week. Additional upside from this point has tops around 1.3342 in sight, closely followed by the 2017 yearly opening level at 1.3434 and trend line resistance taken from the peak at 1.3661. Overall, the immediate trend faces north since bottoming in September 2017, though this move could also be considered a deep pullback in a larger downtrend from the 1.4689 peak in early January 2016.
Areas of consideration:
Outlook unchanged.
1.3314/1.3287 on the H4 timeframe is certainly an area of resistance to keep an eye on for potential shorts.
More immediate, however, we could witness a retest at 1.32 form should sellers defend 1.3239. A long based off this level has the backing of weekly price rallying from its trend line support, and daily price recently crossing above its 50-day SMA. In order to help avoid a whipsaw to November’s opening level at 1.3168, though, traders may opt to wait and see if a H4 bullish candlestick signal forms before pulling the trigger, targeting 1.3239 as the initial upside target.
USD/CHF:
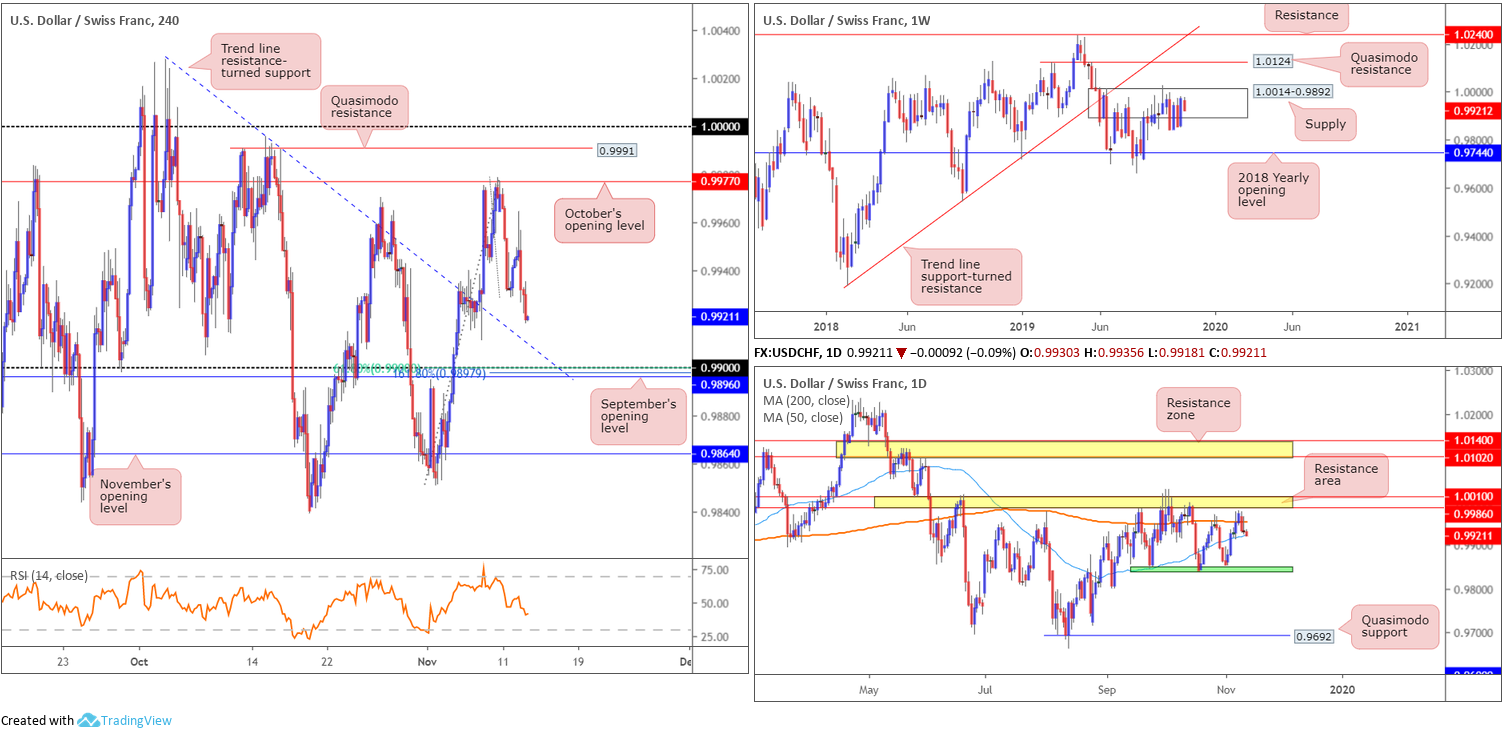
In recent hours, demand for the Swiss franc picked up, consequently guiding USD/CHF lower in early Asia. With the current H4 candle closing not too far off its lows, price is potentially poised to cross swords with 0.99, which happens to merge closely with September’s opening level at 0.9896, a 61.8% Fibonacci retracement at 0.9900, a 161.8% Fibonacci ext. point at 0.9897 and a trend line resistance-turned support taken from the high 1.0027.
The story on the daily timeframe sees the current candle touching gloves with its 50-day SMA (blue – 0.9922) after reclaiming the 200-day SMA (orange – 0.9952) to the downside. A break of the said 50-day function could witness a move towards 0.9845ish (green).
Supply at 1.0014-0.9892 sited on the weekly timeframe remains in play. The beginning of October witnessed a penetration to the outer edge of the supply area’s limit, possibly tripping a portion of buy stops and weakening sellers. An upside move out of the said supply may draw in Quasimodo resistance at 1.0124, while downside has the 2018 yearly opening level at 0.9744 in sight. According to the primary trend, price also reflects a slightly bullish tone; however, do remain aware we have been rangebound since the later part of 2015 (0.9444/1.0240).
Areas of consideration:
Although boasting limited support from the higher timeframes, the 0.99 handle, along with its supporting confluence on the H4 timeframe (see above), is perhaps sufficient to entice buyers into the market for at least a bounce. Given the area of support is small in size, waiting for a H4 bullish candlestick configuration to form is certainly something to consider knowing psychological levels are often whipsawed (entry/risk levels can be determined according to the H4 bull candle pattern).
Dow Jones Industrial Average:
Major US equity indexes wrapped up Tuesday mostly higher, following US President Trump suggesting the US is close to signing a ‘phase one’ trade deal with China, though did not offer clarity on a rollback of import tariffs. The Dow Jones industrial average closed flat; the S&P 500 advanced 4.83 points, or 0.16% and the tech-heavy Nasdaq 100 rose 21.88 points, or 0.27%.
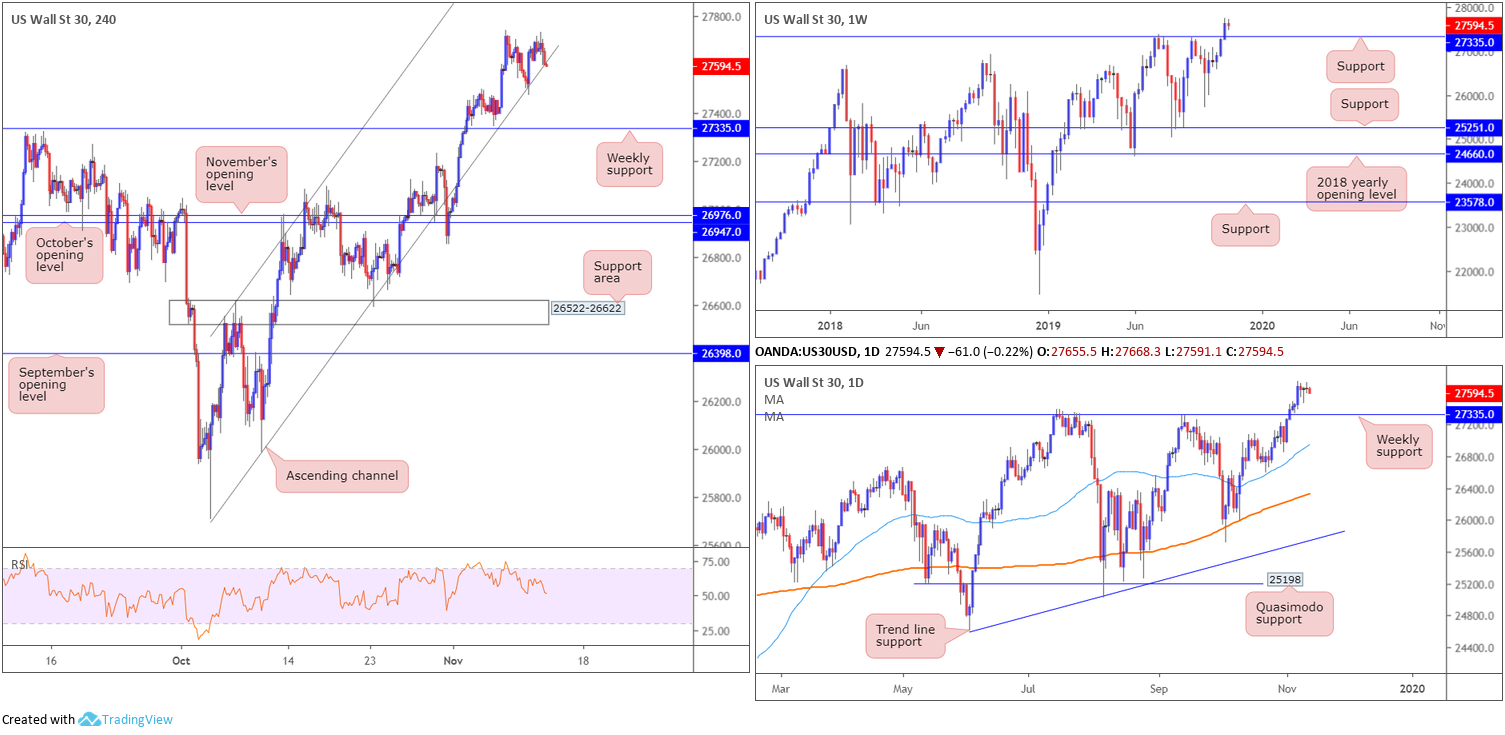
The Dow’s technical picture reveals the H4 candles are seen teasing channel support extended from the low of 25710. As of yet, price action has failed to generate much to the upside off this point; in fact, a mild break is evident according to current price which may spur selling back towards weekly support priced in at 27335.
Areas of consideration:
A decisive H4 close beneath the current H4 channel support may offer sellers a chance to short back to weekly support at 27335. However, do remain cognisant the Dow recently clocked fresh all-time highs and the primary trend has been in motion for a number of years.
In the event we do cross paths with weekly support, waiting for either a H4 or daily bullish candlestick signal to develop is recommended as this could be a pivotal location to join the current trend (entry and risk can be set according to the selected candlestick pattern).
XAU/USD (GOLD):
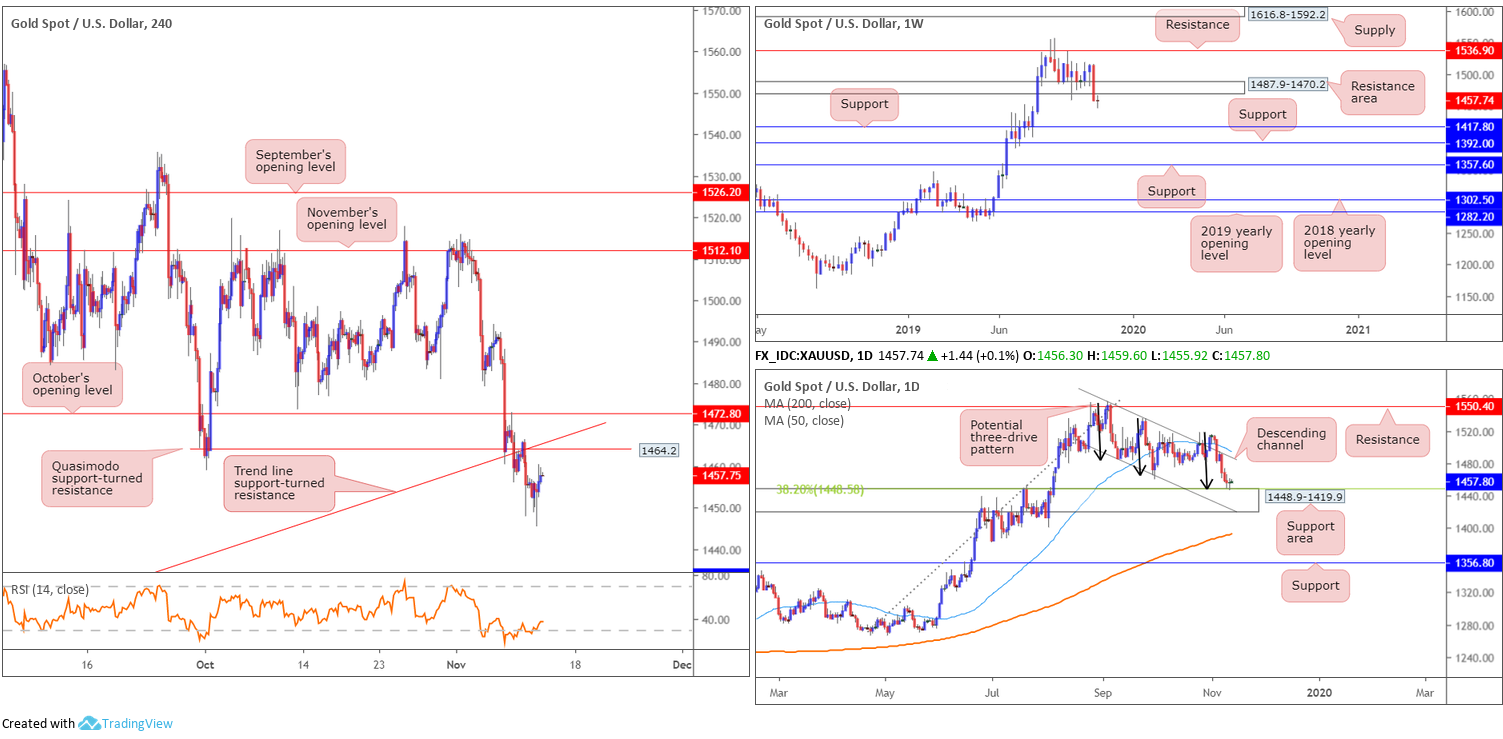
Gold prices finished Tuesday mostly unmoved, though did print a half-hearted hammer candlestick formation on the daily timeframe (considered a bullish signal) off the top edge of a support area coming in at 1448.9-1419.9 (aligns closely with a 38.2% Fibonacci retracement ratio at 1448.5). What’s also interesting here is the completion of a potential three-drive pattern around the top edge of the said support zone (black arrows).
From the H4 timeframe, a move higher will draw price action back to Quasimodo support-turned resistance at 1464.2, closely trailed by a trend line support-turned resistance etched from the low 1381.9 and then October’s opening level at 1472.8.
Weekly price, on the other hand, dethroned a significant support area at 1487.9-1470.2 last week, suggesting a continuation to the downside to supports coming in at 1392.0 and 1417.8.
Areas of consideration:
Technically speaking, XAU/USD offers conflicting signals at present. On one side we have weekly price portending a reasonably considerable move lower, while on the other side of the field daily price threatens a recovery from the top edge of its support area/three-drive completion. As you can see, irrespective of the direction selected, opposition is clear on both sides of the market.
A retest of the H4 resistances between 1472.8/1464.2 is a likely scenario today, but selling this area, although alongside weekly flow, places you strongly in the face of daily buyers. While weekly structure typically dominates lower timeframes, traders are still urged to trade with caution.
The accuracy, completeness and timeliness of the information contained on this site cannot be guaranteed. IC Markets does not warranty, guarantee or make any representations, or assume any liability regarding financial results based on the use of the information in the site.
News, views, opinions, recommendations and other information obtained from sources outside of www.icmarkets.com.au, used in this site are believed to be reliable, but we cannot guarantee their accuracy or completeness. All such information is subject to change at any time without notice. IC Markets assumes no responsibility for the content of any linked site.
The fact that such links may exist does not indicate approval or endorsement of any material contained on any linked site. IC Markets is not liable for any harm caused by the transmission, through accessing the services or information on this site, of a computer virus, or other computer code or programming device that might be used to access, delete, damage, disable, disrupt or otherwise impede in any manner, the operation of the site or of any user’s software, hardware, data or property.