Bitcoin Price Prediction: BTC/USD is poised for a short-term growth — Confluence Detector
![]()
- BTC/USD has been moving within a short-term bullish trend since August 27
- The technical picture implies that the upside momentum may gain traction.
Bitcoin (BTC) hit the intraday high at $11,713 and retreated below has settled above $11,700 on Monday. The first digital asset has been on recovery track from August 27, when it hit the recent bottom of $11,227. At the time of writing, BTC/USD is changing hands at $11,680, mostly unchanged both on a day-to-day basis and since the beginning of the day. Bitcoin’s dominance index dropped to 57.8% amid the strong growth of smaller cap coins.
BTC/USD 1-hour chart
-637344742575968832.png)
On the intraday charts, BTC/USD has been moving within an upside-looking Bollinger Band with the local support created by its lower boundary and 1-hour SMA50 at $11,595. The short-term trend remains bullish as long as the price stays above this technical barrier. However, once it is broken, the sell-off may be extended to $11,500, which is reinforced by 1-hour SMA100. On the upside, a sustainable move above $11,700 is needed for the recovery to gain traction.
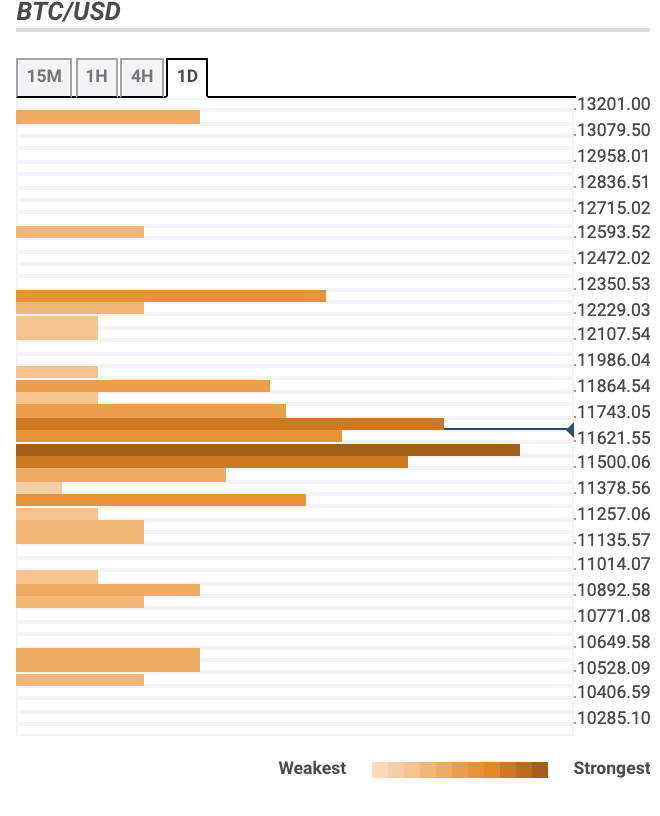
Bitcoin confluence levels
The vast majority of technical barriers are clustered both below the current price, which means the price may be better positioned for further recovery. Let’s have a closer look at support and resistance levels for BTC/USD.
Resistance levels
$11,700 – the middle lines of the 1-hour and daily Bollinger Bands, 23.6% Fibo retracement daily
$11,850 – the highest level of the previous week, Pivot Point 1-week Resistance 1
$12,300 – Pivot Point 1-month Resistance 1, 161.8% Fibo projection weekly
Support levels
$11,5000 – 1-hour SMA100 and SMA200, 4-hour SMA50, 61.8% Fibo retracement weekly, the middle line of the 4-hour Bollinger Band
$11,300 – 23.6% Fibo retracement weekly, 161.8% Fibo projection daily, Pivot POint 1-day Support 3
$11,000 – daily SMA50