Wednesday 16th September: Technical Outlook and Review

Key risk events today:
UK CPI y/y; US Retail Sales m/m; US Core Retail Sales m/m; Crude Oil Inventories; FOMC Economic Projections, FOMC Statement, Federal Funds Rate and Press Conference; New Zealand GDP q/q.
(Previous analysis as well as outside sources – italics).
EUR/USD:
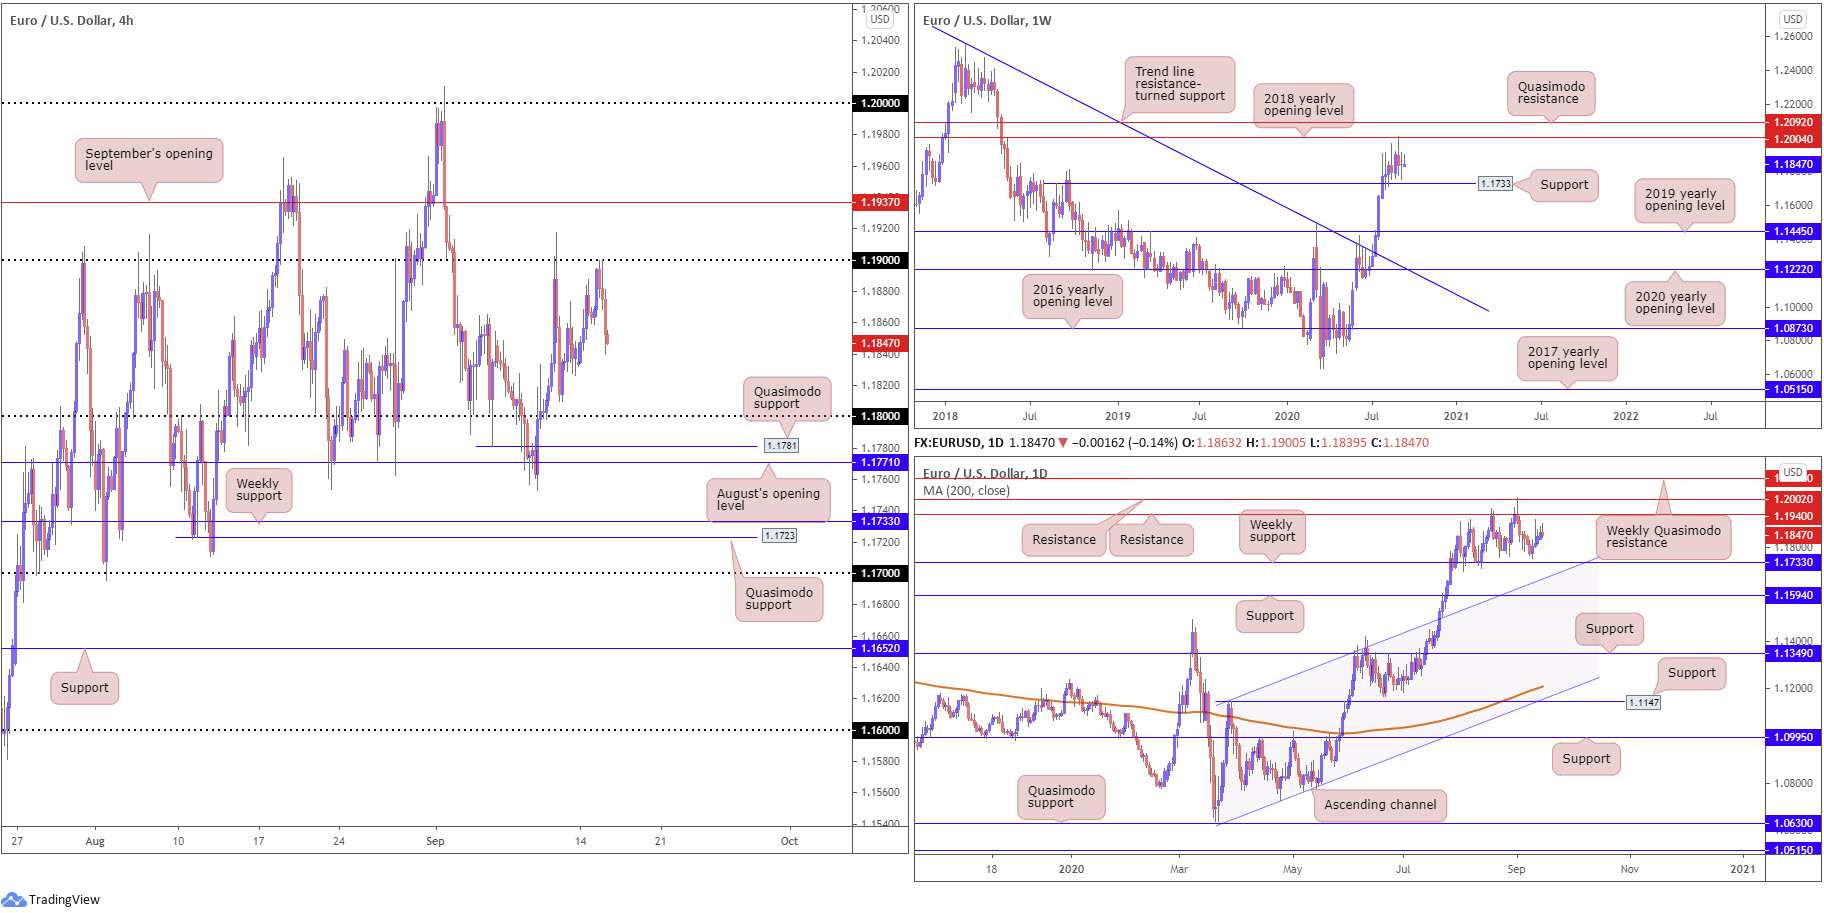
As the DXY closes out Tuesday off worst levels (92.79), EUR/USD on the H4 spun lower from the 1.19 handle in reasonably strong fashion. Above 1.19, September’s opening value is seen at 1.1937; to the downside 1.18 invites an approach. Beyond 1.18, Quasimodo support at 1.1781 is visible, followed by August’s opening level at 1.1771.
Further afield, weekly support is seen at 1.1733, a previous Quasimodo resistance; resistance can also be found at 1.2004, the 2018 yearly opening value sited just south of Quasimodo resistance priced in at 1.2092. Also clear on the weekly scale is the month of July witnessed vigorous upside, overthrowing trend line resistance, taken from the high 1.2555, and the 2019 yearly opening value at 1.1445.
Since transitioning into the month of August on the daily timeframe, weekly support, mentioned above at 1.1733, has proved useful, as has daily resistance coming in at 1.1940 and 1.2002. Passing 1.2002 on the daily timeframe shifts focus to the weekly Quasimodo resistance mentioned above at 1.2092, whereas dipping sub 1.1733 on the daily scale could see price make its way to channel resistance-turned support, extended from the high 1.1147.
Areas of consideration:
- A fakeout through 1.18 into H4 Quasimodo support from 1.1781 and August’s opening level at 1.1771 could be in store. Tripping sell-stop liquidity under 1.18, and luring any fresh buyers off noted H4 supports, may be enough to generate a H4 close back above 1.18, creating a possible intraday buy signal.
- The same can be seen above 1.19 on the H4, though right now the round number is proving a tough nut to crack. Piercing 1.19 and testing September’s opening level at 1.1937 (tripping buy-stop liquidity above the round number) may force a H4 close back under 1.19 and promote a bearish scenario. Note September’s opening level forms a close connection with daily resistance at 1.1940.
GBP/USD:
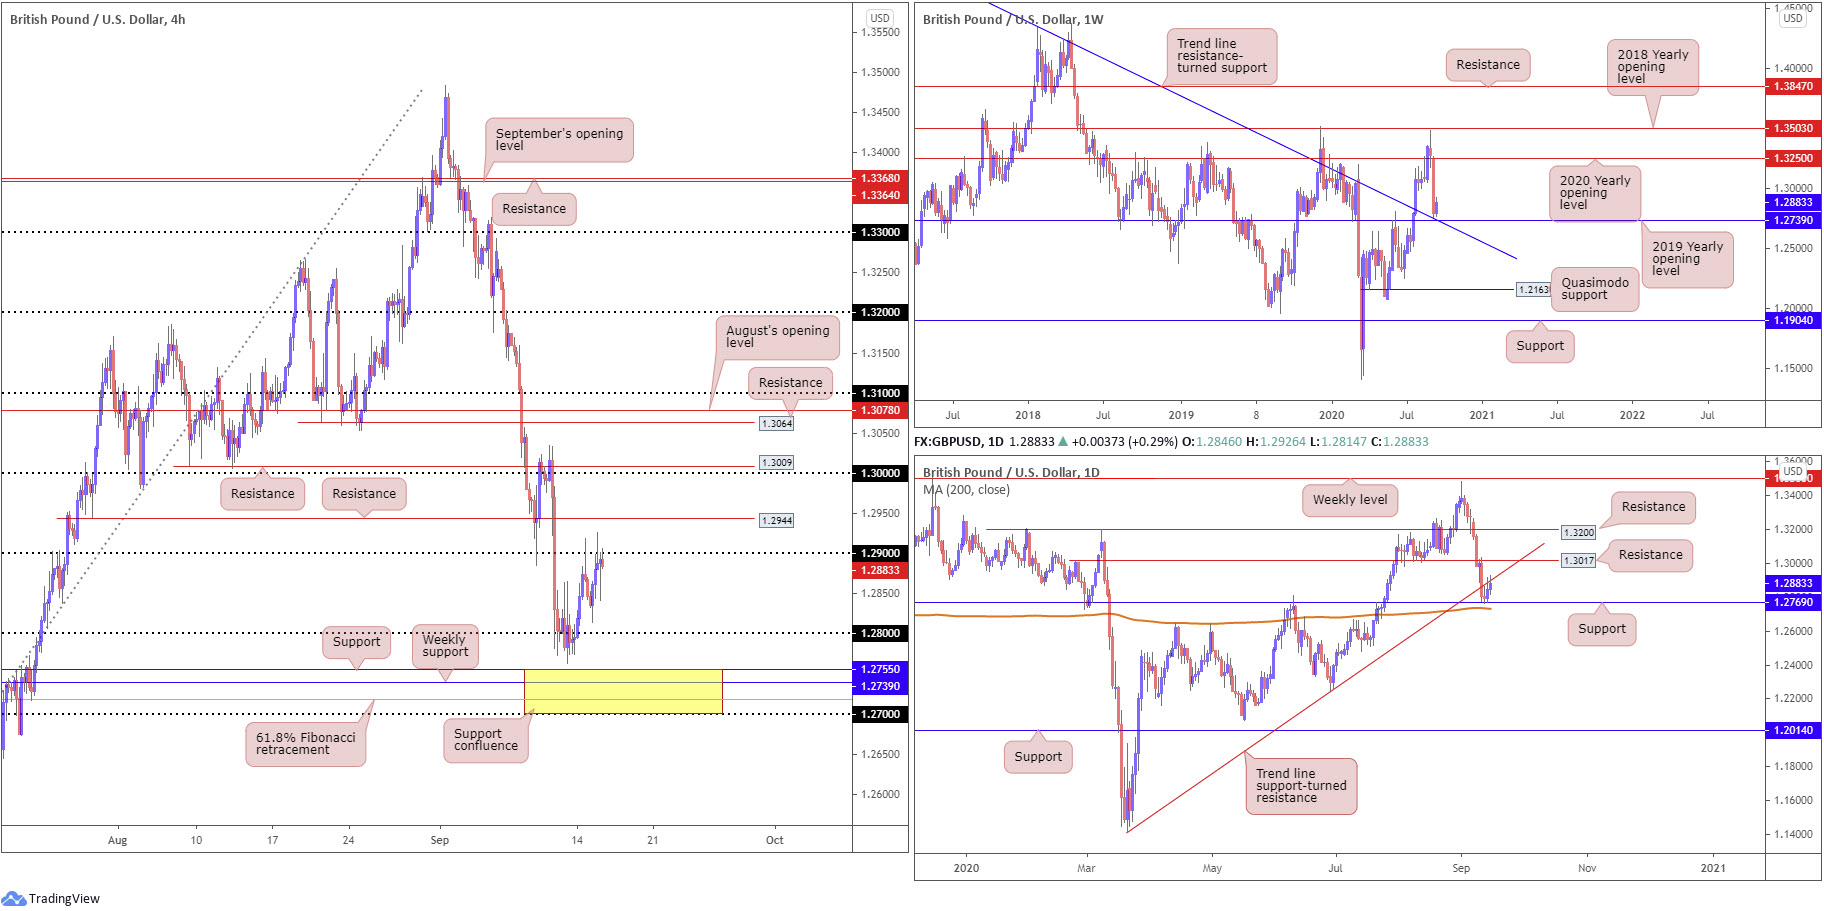
Early momentum derived from UK jobs and earnings found 1.29 a difficult hurdle to overcome on Tuesday, despite flirting with peaks at 1.2926. H4 posts nearby resistance at 1.2944, with a break here perhaps exposing the key figure 1.30 and another layer of resistance plotted at 1.3009.
What’s technically appealing around 1.29 is a daily trend line support-turned resistance, taken from the low 1.1409, converges with the round number. The daily trend line made a show following a mild recovery from daily support at 1.2769 (ahead of the 200-day SMA [orange – 1.2732]) last week.
On the other side of the field, weekly price is making a stand just north of support in the form of the 2019 yearly opening level at 1.2739 and aligning trend line resistance-turned support, extended from the high 1.5930. We also see room to advance as far north as the 2020 yearly opening level at 1.3250.
Areas of consideration:
Bearish themes could develop from 1.29 today – the level benefits from daily trend line resistance. However, a spike to H4 resistance at 1.2944 could also take shape prior to sellers making an appearance. Moves from 1.2944/1.29 likely have 1.28 set as a downside target, followed by the support area at 1.27/1.2755 (yellow), applied to the H4 scale.
AUD/USD:
For those who read Tuesday’s technical briefing you may recall the following (italics):
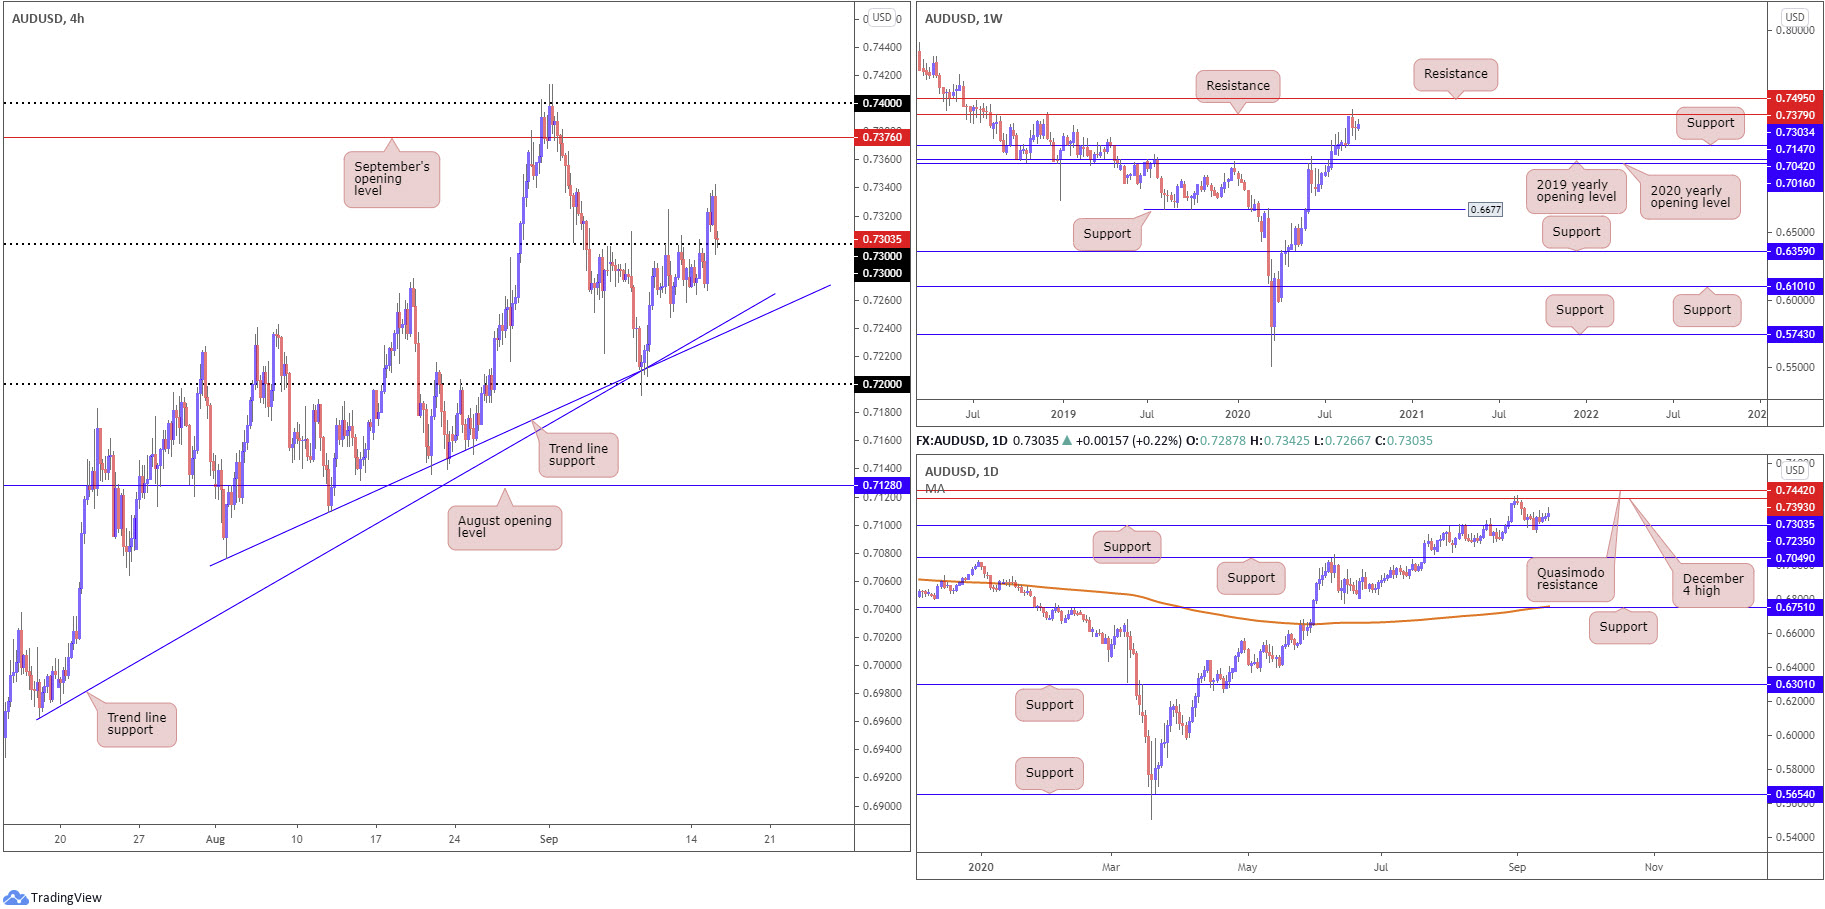
Although 0.73 has proven a tough nut to crack, it appears sellers may be loosening their grip. In addition to Thursday’s spike to 0.7324 potentially filling the majority of sellers’ protective stop loss orders, the lack of downside pressure seen since informs observers buyers are likely taking control.
A H4 close above 0.73, therefore, might arouse breakout buyers; a retest at the round number following a close higher could also tempt conservative players to participate.
Irrespective of the entry technique, 0.74/0.7376 offers a logical upside target.
As evident from the H4 chart this morning, AUD/USD latched onto a healthy bid Tuesday, ripping through any defence 0.73 had in place. Peaks of 0.7342 were achieved before the pair reclaimed earlier gains and retested 0.73 as support.
The weekly timeframe’s picture remains unchanged:
Sellers south of resistance at 0.7379 failed to sustain downside momentum past 0.7191 in recent trading, leaving nearby support from 0.7147 unchallenged. Having seen this market trend higher since bottoming at 0.5506 in late March, the odds of price surging through current resistance and heading for another layer of resistance at 0.7495 are high. Exploring territory under current support, however, shines focus on the 2020 and 2019 yearly opening levels at 0.7016 and 0.7042, respectively.
The daily timeframe also exhibits unchanged structure:
Price has so far failed to glean much support from 0.7235. To the upside, however, resistance at 0.7393 (December 4 high) commands attention, a level that capped upside heading into September ahead of Quasimodo resistance at 0.7442. Overthrowing 0.7235 shifts focus to as far south as support at 0.7049.
Areas of consideration:
Conservative buyers are likely weighing up the odds of entering into a long position from the recent 0.73 retest. Technically, there’s room for buyers to stretch their legs until reaching September’s opening level at 0.7376 on the H4, followed by weekly resistance at 0.7379 along with daily resistance (Dec 4 high) from 0.7393 and then 0.74 (H4). Therefore, a H4 bullish candlestick signal developing from 0.73 may elbow buyers into the market today.
USD/JPY:
For those who read Tuesday’s technical piece you may recall the following (italics):
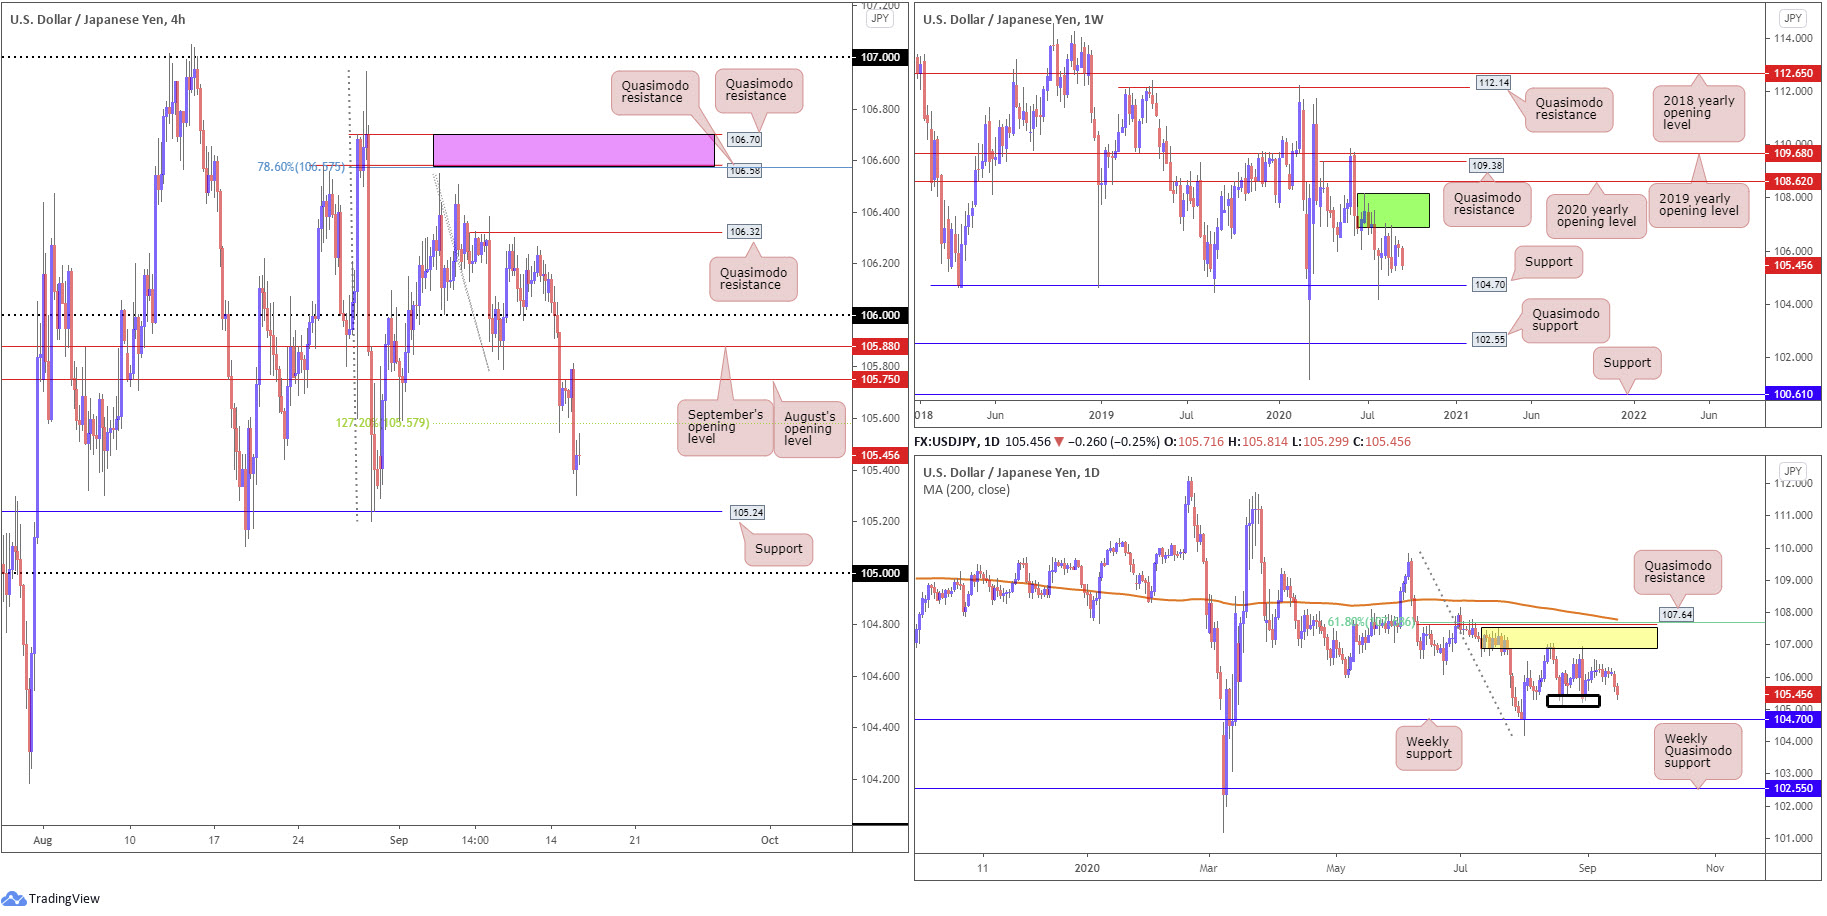
Room seen to push lower on the higher timeframes might see bearish themes emerge from August’s opening value on the H4 at 105.75 today. Though do bear in mind a spike to September’s opening value at 105.88 could also take shape before sellers make an appearance.
Sellers from 105.88/105.57 are likely to consider reducing risk to breakeven upon crossing the 127.2% Fibonacci extension point at 105.57, with a downside target plotted at H4 support around 105.24 (essentially representing the daily lows around 105.20).
As can be seen from the H4 scale this morning, price held August’s opening level at 105.75 Tuesday as resistance and charged to lows at 105.30, bottoming a handful of pips ahead of support at 105.24.
Supply remains prominent at 108.16-106.88 (dark green) on the weekly timeframe, capping upside since price made its way off support at 104.70 at the end of July. Should buyers govern control, the 2020 yearly opening level at 108.62 may eventually enter view, closely tracked by Quasimodo resistance at 109.38 and the 2019 yearly opening level at 109.68.
Daily supply at 107.55/106.89 (yellow), an area housed within the lower boundary of weekly supply mentioned above at 108.16-106.88, has proved tough to overthrow. Downside from current price has lows at 105.20ish to target (black zone), with a break exposing weekly support underlined above at 104.70. In the event buyers climb, however, Quasimodo resistance is stationed at 107.64, reinforced by a 61.8% Fibonacci retracement ratio at 107.68 and 200-day SMA (orange – 107.78).
Areas of consideration:
Short sellers from 105.75 finished Tuesday’s session in the green, with scope to push for H4 support at 105.24 and the 105 handle. Ultimately, if we cross under 105, we’re then likely looking at re-joining weekly support at 104.70.
Consequently, some of the current sellers will leave a portion of their position running to take advantage of any further downside that may emerge.
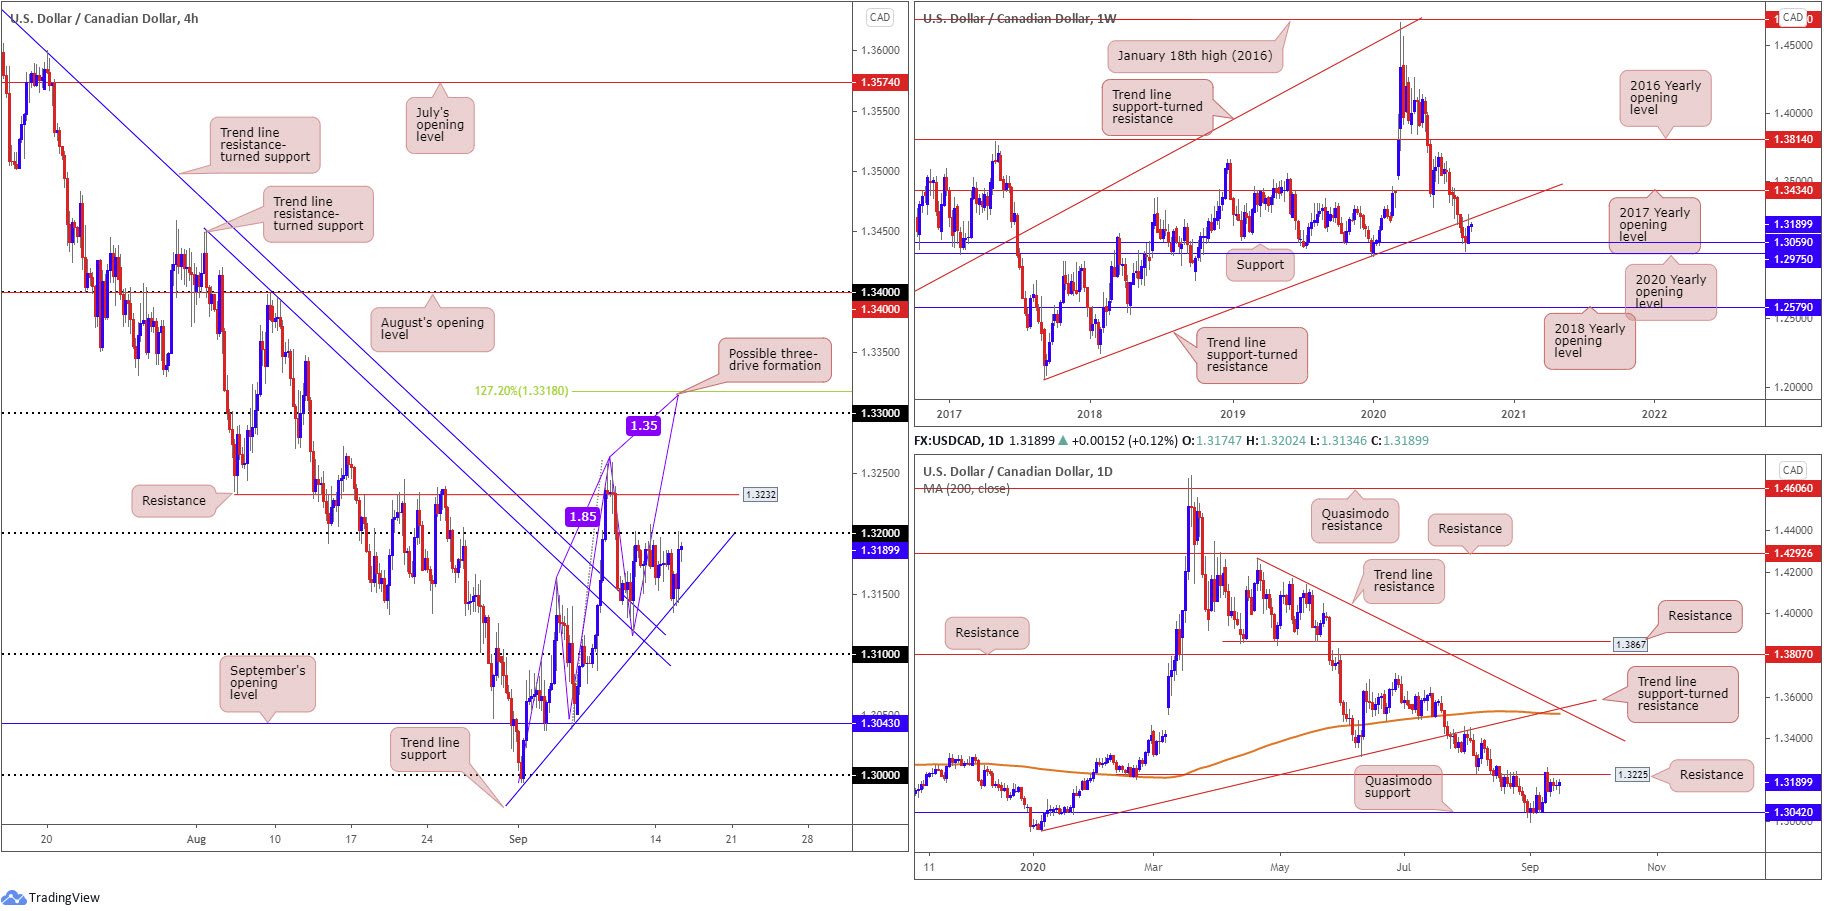
USD/CAD:
USD/CAD pared earlier losses Tuesday, technically sponsored by H4 trend line support (taken from the low 1.2994), ending the session a shade higher. As shown on the H4 timeframe, we remain clinging to the underside of 1.32. As you can see, price has been caught within a narrow range south of the round number since last Thursday’s recovery from two trend line resistances-turned support, extended from highs 1.3646 and 1.3451.
Brushing aside 1.32 turns attention back to resistance at 1.3232, with a break perhaps exposing the 1.33 handle and a possible three-drive completion at the 127.2% Fibonacci extension point from 1.3318. Traders may also wish to acknowledge the H4 resistance boasts a close connection with daily resistance at 1.3225.
From the weekly timeframe:
Snapping an eight-week bearish phase, USD/CAD staged a stronger-than-expected recovery last week off support at 1.3059 (pinned just north of the 2020 yearly opening level at 1.2975). This led to trend line support-turned resistance, taken from the low 1.2061, making an appearance, commanding enough of a presence to generate a mild end-of-week correction. Continued upside highlights the 2017 yearly opening level at 1.3434 as potential resistance.
From the daily timeframe:
Quasimodo support at 1.3042 remained a notable base last week, with the buck latching onto a strong bid in early trading to shake hands with resistance mentioned above at 1.3225, a prior Quasimodo support. Interest from the aforementioned resistance was expected having seen the level merge with weekly trend line resistance. In terms of resistance beyond 1.3225, we do not see much to hang our hat on until crossing swords with trend line resistance, etched from the high 1.4265, which happens to align closely with trend line support-turned resistance, taken from the low 1.2957, and the 200-day SMA (orange – 1.3519). However, before reaching the said daily levels, we must contend with weekly resistance around 1.3434.
Areas of consideration:
Outlook unchanged due to the recent lacklustre performance.
On one side, weekly support at 1.3059 and daily Quasimodo support at 1.3042 recently made an appearance, prompting a bullish move. On the other side we also had weekly price test trend line resistance and daily price probe resistance from 1.3225.
With the above in mind, seeking bullish scenarios above 1.32 on the H4 could prove frustrating, hindered by daily resistance from 1.3225 and H4 resistance at 1.3232. A sell-off from 1.3232/1.32, therefore, could take hold, bolstered by weekly price also recently engaging trend line resistance and the market trending lower since mid-March. H4 sellers, however, may wait for trend line support (1.2994) to be taken before committing.
Climbing above 1.3232, nevertheless, ignites the possibility of bullish themes and places 1.33 (H4) in the firing range (and a three-drive pattern completion around 1.3318).
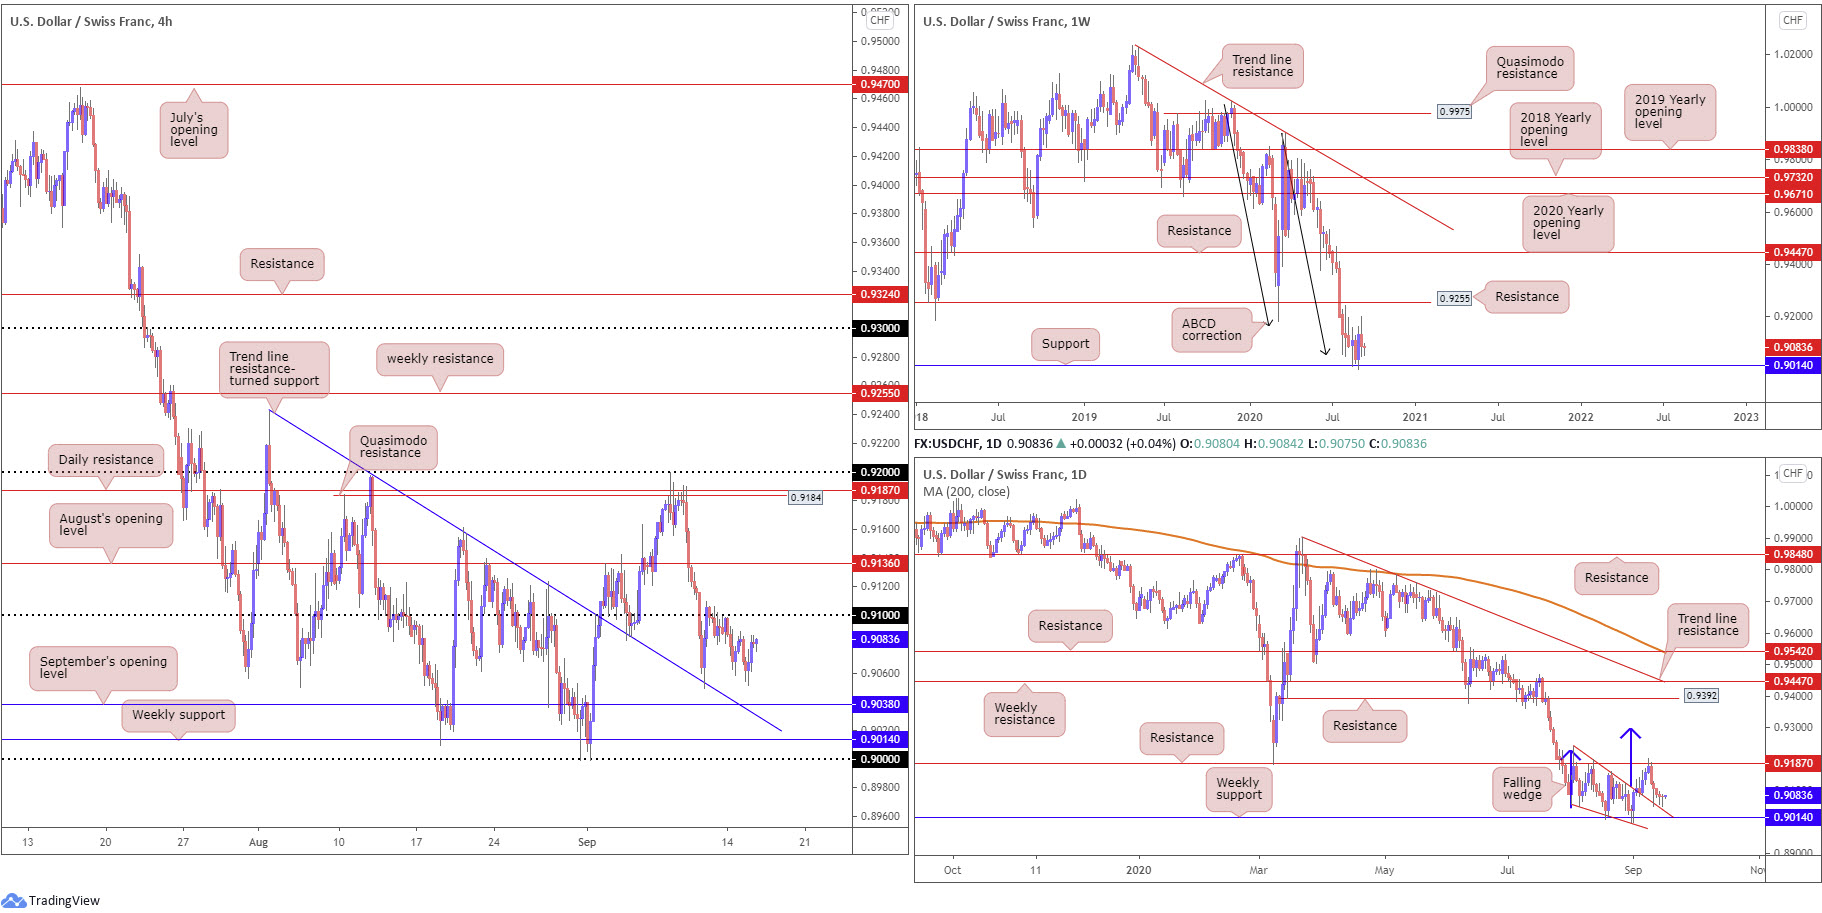
USD/CHF:
Given Tuesday’s lacklustre close, the following echoes similar thoughts put forward in recent writing.
USD/CHF, once again, finished the day off session lows, establishing back-to-back daily hammer candlestick formations (bullish signals).
0.91 remains a point of resistance on the H4 timeframe, with support fixed at 0.9038, September’s opening value (sharing space with a trend line resistance-turned support, taken from the peak 0.9241). Above 0.91, August’s opening value at 0.9136 steps in view, while brushing aside this base places H4 Quasimodo resistance at 0.9184 in sight (and daily resistance at 0.9187).
Technical movement on the weekly timeframe shows buyers and sellers continue to battle for position north of support at 0.9014, potentially gleaning additional impetus from ABCD support at 0.9051 (black arrows). Resistance at 0.9255, a previous Quasimodo support level, calls for attention should we transition north.
The month of August on the daily timeframe chalked up a falling wedge pattern from the high 0.9241 and a low of 0.9056. The beginning of September saw the upper border of the falling wedge give way, consequently unlocking a bullish reversal signal. Resistance at 0.9187 swiftly put a lid on gains, however, directing moves to just north of the falling wedge. Should we see buyers take over from current price and upset resistance at 0.9187, the falling wedge take-profit target could be the next port of call around 0.9294 (blue arrows). Further dips, nonetheless, brings in weekly support at 0.9014.
Areas of consideration:
Although the current trend displays a strong bearish posture, buyers are attempting to make a stand off weekly support at 0.9014. In addition to this, daily price is establishing support north of the falling wedge upper boundary.
An attempt to breach 0.91 is possible on the H4. This would likely see buyers target August’s opening level at 0.9136, with the prospect of additional upside pressure forcing price to touch gloves with daily resistance at 0.9187.
Breakout buyers north of 0.91 could latch on to the breakout candle’s close as a means of entry; other traders might seek a retest at the round number before pulling the trigger.
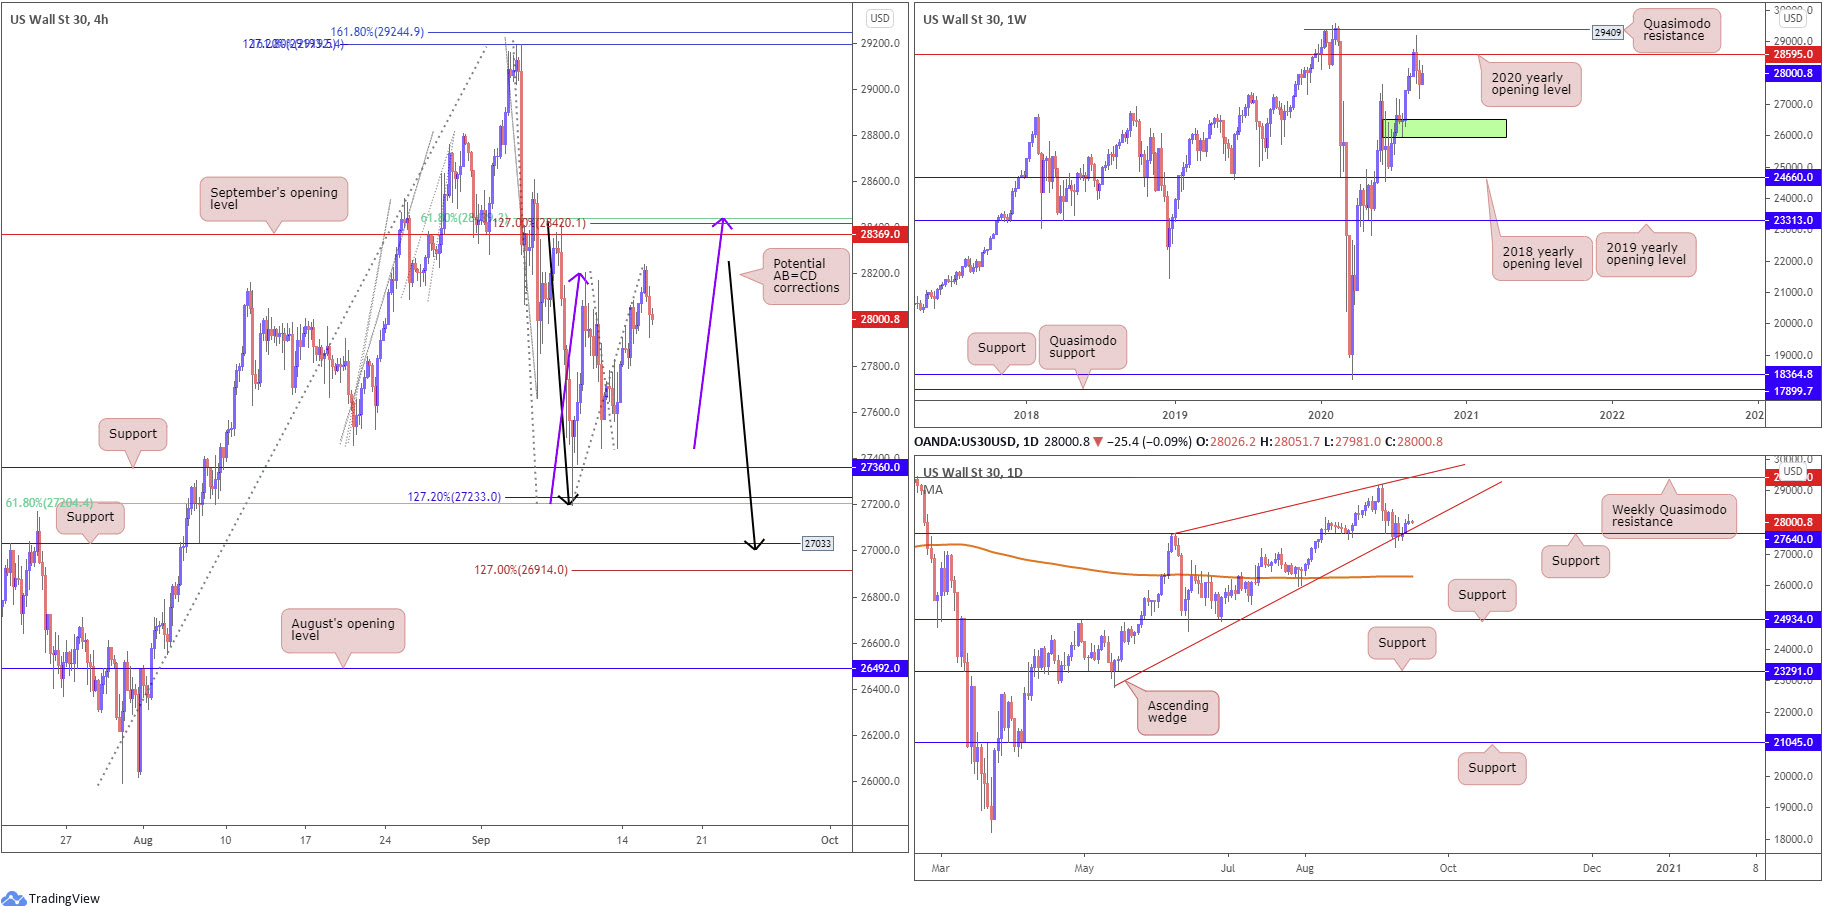
Dow Jones Industrial Average:
Elevated on the back of a rally in technology stocks, US equity benchmarks mostly advanced Tuesday. The Dow Jones Industrial Average ended flat; the S&P 500 rallied 17.66 points, or 0.52% and the Nasdaq traded higher by 133.67 points, or 1.21%.
Technically, limited change has been seen.
The H4 timeframe reveals support at 27360, shadowed closely by a 127.2% Fibonacci extension point at 27233 and a 61.8% Fibonacci retracement ratio at 27204. Beyond the latter, we’re watching support at 27033, a level that joins closely with a potential AB=CD correction (black arrows) at 26985 and 1.27 BC projection at 26914. To the upside, September’s opening value at 28369 rests as possible resistance, joined by a 61.8% Fibonacci retracement ratio at 28436 and a potential AB=CD bearish pattern (purple arrows) at 28418, along with a 1.27 BC projection at 28420.
Further out, weekly shows price holding south of the 2020 yearly opening value at 28595 (sited just under Quasimodo resistance at 29409). Additional bearish sentiment advertises demand (green) at 25916-26523, an area active buyers may try and defend.
From the daily timeframe, the lower limit of an ascending wedge, taken from the low 22803, along with support from 27640, continues to bolster the unit. Rupturing the aforementioned supports could lead to price crossing paths with the 200-day SMA (orange – 26297), while a recovery positions the 2020 yearly opening level at 28595 (weekly timeframe) in range.
Areas of consideration:
H4 support found between 27204/27360 could hamper downside and perhaps promote bullish themes, as could H4 support at 27033 and joining AB=CD correction.
It is also worth pencilling in September’s opening value at 28369 on the H4, having seen its connection with a 61.8% H4 Fibonacci retracement ratio at 28436 and AB=CD confluence.
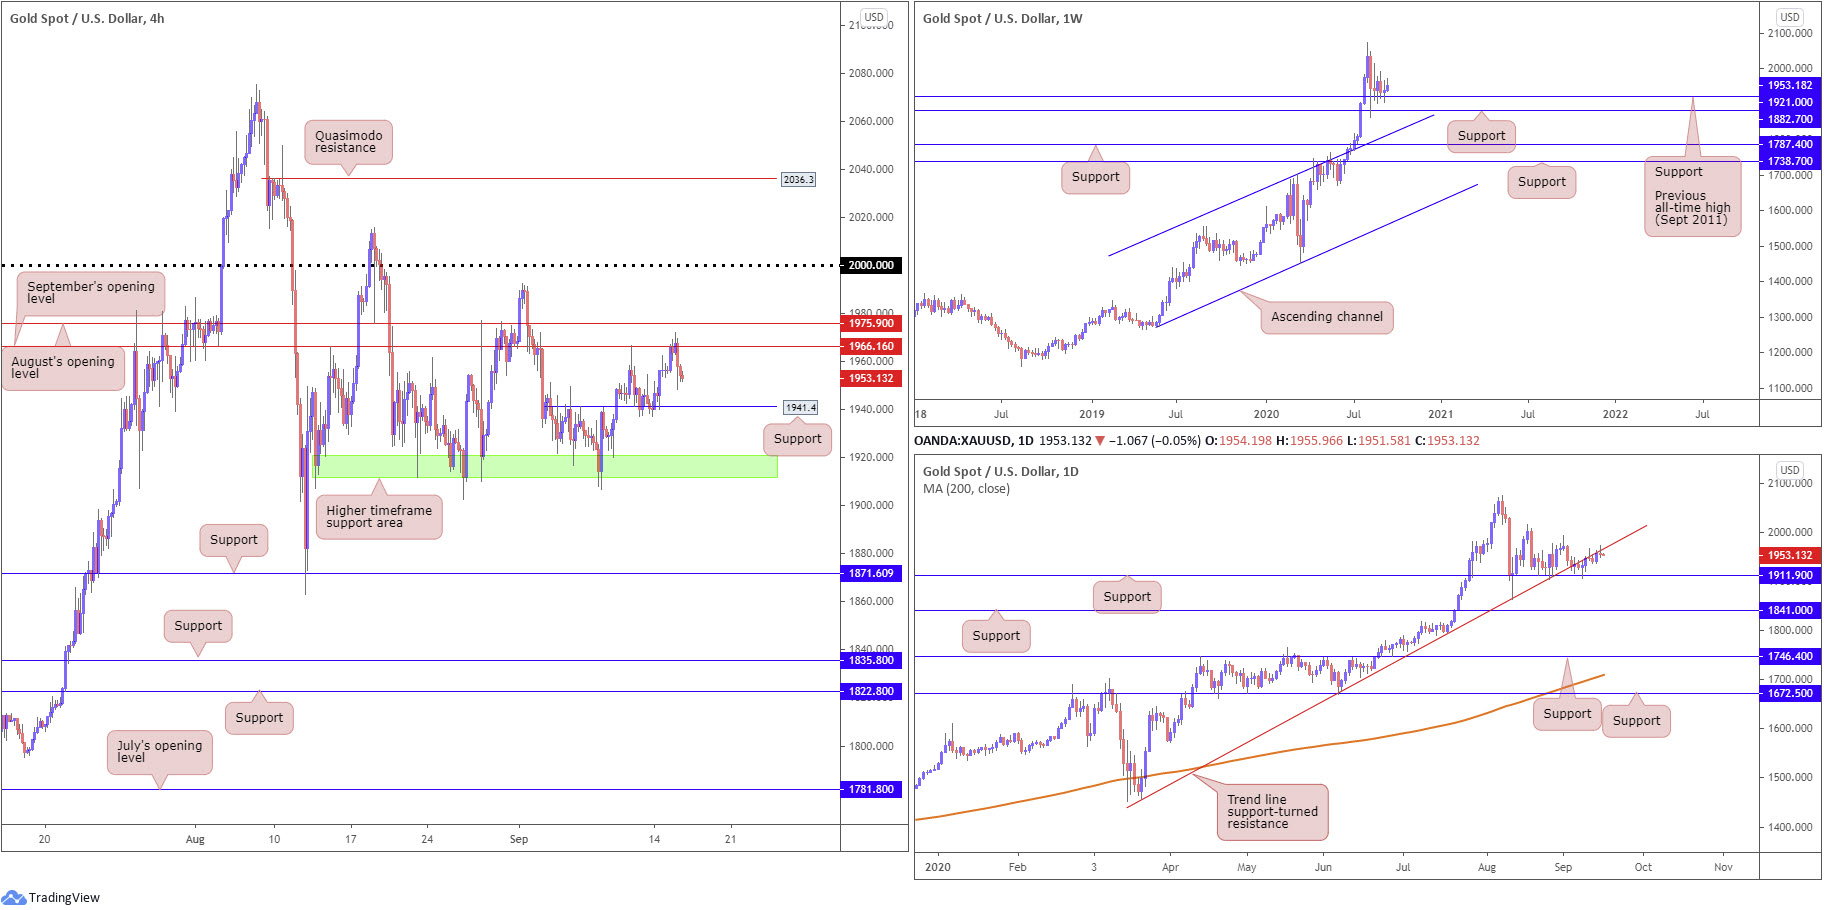
XAU/USD (GOLD):
Kicking off from the top this morning, we can see weekly price remains buoyed by $1,921 support (located ahead of support at $1,882), the previous major all-time high (September 2011). With the current trend trekking north since 2016, the support combination between $1,882 and $1,921 may be enough to encourage additional buying, with most targeting all-time peaks at $2,075 as the initial point. Failure to hold gains could see channel resistance-turned support, etched from the high $1,703, enter view.
From the daily timeframe, candle activity continues to hold onto gains north of support at $1,911, though is seen grinding along the underside of a trend line support-turned resistance, taken from the low $1,455. Further buying targets the $1,992 September 1 high and the $2,015 August 18 high. A dip to lower terrain, on the other hand, will draw weekly support mentioned above at $1,882 into the frame.
Across the page on the H4, September’s opening value at $1,966 is proving a tough level to overcome, following a recent retest at support from $1,941. Above August’s opening value at $1,975, traders will likely be reaching for $2,000.
Areas of consideration:
A $1,941 support retest could emerge on the H4 timeframe today, a level that may appeal to dip buyers, particularly after forming a higher peak yesterday. A recovery from the support is backed by the weekly timeframe, though currently against daily structure. A H4 bullish candlestick signal formed from the noted support may persuade buying, targeting $1,966/$1,975 as a primary point on the H4.
Should we fail to secure support, traders’ crosshairs are likely to drop back to the higher timeframe support at $1,911.90-$1,921.00 (green H4), an area which has plugged downside since August.
The accuracy, completeness and timeliness of the information contained on this site cannot be guaranteed. IC Markets does not warranty, guarantee or make any representations, or assume any liability regarding financial results based on the use of the information in the site.
News, views, opinions, recommendations and other information obtained from sources outside of www.icmarkets.com.au, used in this site are believed to be reliable, but we cannot guarantee their accuracy or completeness. All such information is subject to change at any time without notice. IC Markets assumes no responsibility for the content of any linked site.
The fact that such links may exist does not indicate approval or endorsement of any material contained on any linked site. IC Markets is not liable for any harm caused by the transmission, through accessing the services or information on this site, of a computer virus, or other computer code or programming device that might be used to access, delete, damage, disable, disrupt or otherwise impede in any manner, the operation of the site or of any user’s software, hardware, data or property.