Bitcoin Price Analysis: BTC/USD continues to search for direction near $11,000
![]()
- Bitcoin is moving sideways for the third straight day on Saturday.
- $11,200 as a critical resistance in the near-term.
- Sellig pressure could pick up steam with a break below $10,700.
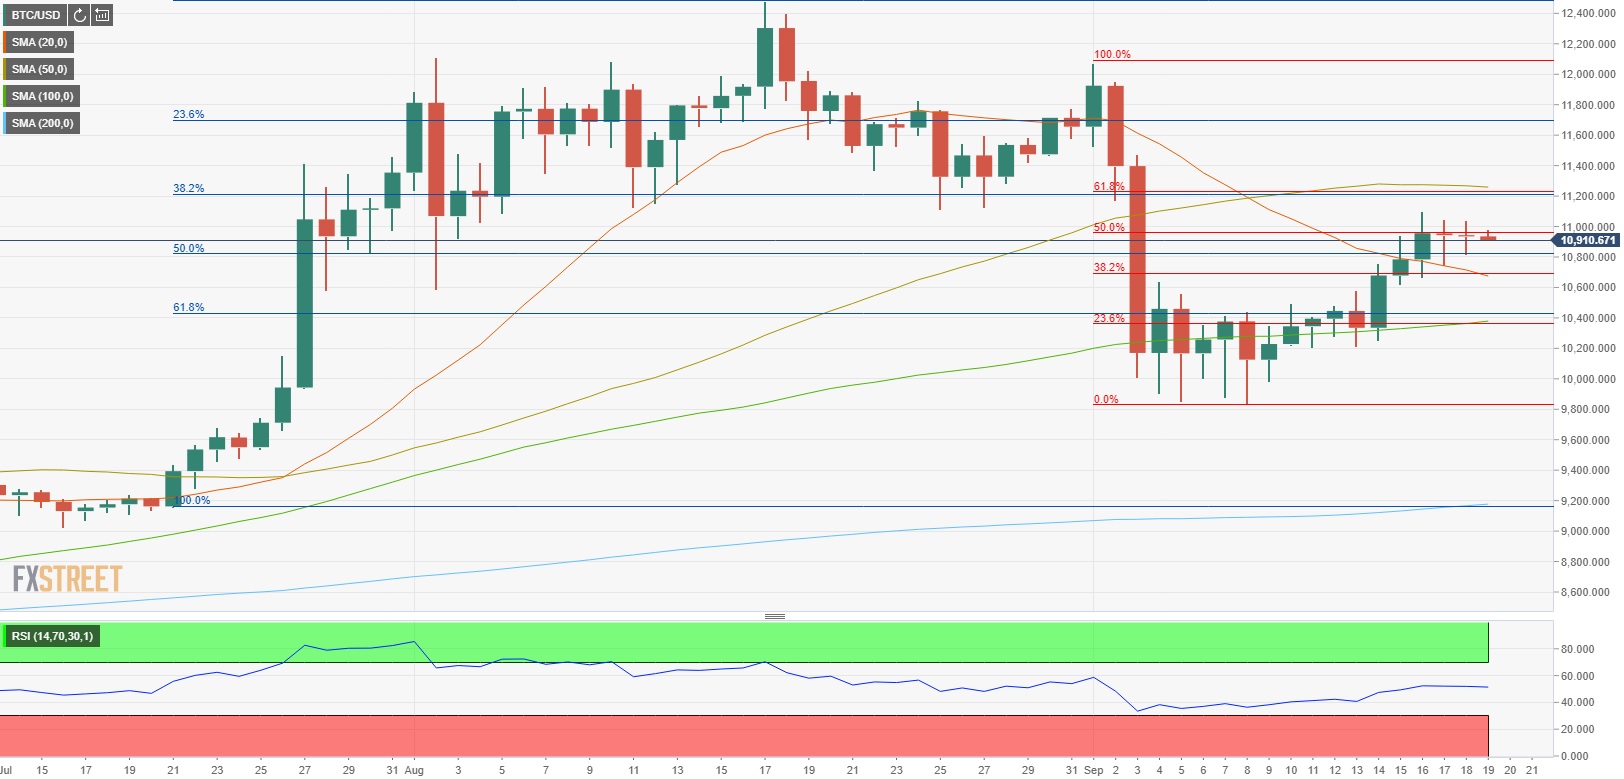
Bitcoin (BTC/USD) closed the previous trading days virtually unchanged near $11,000 and doesn’t seem to be looking to make a decisive move in either direction on Tursday. As of writing, Bitcoin was down 0.35% on a daily basis at $10,900.
BTC/USD technical outlook
On the daily chart, the Relative Strength Index (RSI) indicator continues to move sideways near 50, confirming the indecisiveness of Bitcoin. On the upside, $11,200 area, where the Fibonacci 38.2% retracement of July 21-August 18 uptrend and the Fibonacci 61.8% retracement of the early-September drop is located, aligns as a critical hurdle. The 50-day SMA is also fortifying this resistance. With a daily close above this area, the next target on the upside could be seen at $11,700 (Fibonacci 23.6% retracement of July 21-August 18 uptrend) and $12,000 (psychological level).
On the other hand, the initial support is located at $10,700 (Fibonacci 38.2% retracement of the early-September drop/20-day SMA) ahead of $10,400 (100-day SMA). Below those levels, $10,000 (psychological level) is defending $9,800, the static level that helped Bitcoin reverse its direction after the sharp selloff witnessed during the first week of September.
Bitcoin chart (daily)