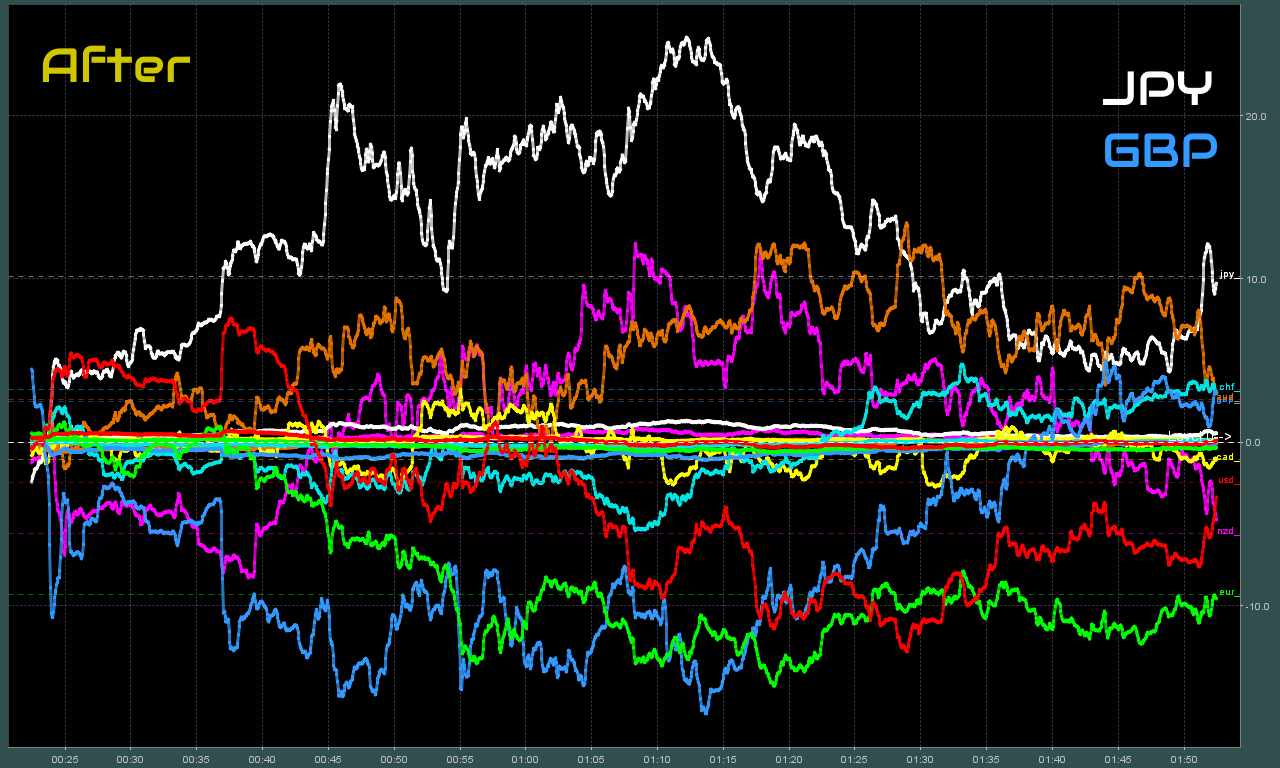
Articles

SNB’s Jordan:  Rising interest rates will not damage financial stability in Switzerland
SNB’s Jordan: Rising interest rates will not damage financial stability in Switzerland

SNB’s Jordan: Rising interest rates will not damage financial stability in Switzerland

316547   May 31, 2023 23:56   FXStreet   Market News  


Share:

Swiss National Bank (SNB) Chairman Thomas Jordan said on Wednesday that Credit Suisse situation was caused by a lack of trust by market participants in the bank rather than rising interest rates, per Reuters.

Jordan further reiterated that they have to bring inflation back below 2% as soon as possible and noted that sees inflation risks higher than deflation in the future, due to deglobalisation.

Market reaction

USD/CHF retreated modestly from the multi-month high it set near 0.9150 earlier in the day and was last seen trading at 0.9125, where it was still up 0.75% on a daily basis.

Full Article

European equity close: DAX closes May on the lows of the month

European equity close: DAX closes May on the lows of the month

316546   May 31, 2023 23:40   Forexlive Latest News   Market News  

It was a painful day for European stock market bulls on Wednesday as broad-based selling hit, despite a German CPI report that could pave the way for an earlier ECB pause.

  • Stoxx 600 -1.1%
  • German DAX -1.7%
  • UK FTSE 100 -1.0%
  • French CAC -1.7%
  • Italy MIB -2.1%
  • Spain IBEX -1.4%

The break and close below the May lows in the DAX is a bad look

I also don’t like the look of the monthly chart.

The DAX party is over

Full Article

USD/CAD battles around the 1.3600 figure, after solid Canadian GDP overshadows US JOLTs data

USD/CAD battles around the 1.3600 figure, after solid Canadian GDP overshadows US JOLTs data

316544   May 31, 2023 23:33   FXStreet   Market News  


Share:

  • The USD/CAD pair teetered around the 1.3600 figure after the Canadian GDP Q1 results exceeded estimates, prompting anticipations of BoC policy tightening.
  • The US labor market reported an unexpected surge in job openings (JOLTs), supporting the case for additional interest rate hikes by the US Federal Reserve.
  • Crude oil’s declining prices and a resilient US Dollar Index supported the greenback, offsetting the pressure from solid Canadian economic performance.

USD/CAD climbs for two straight days, though reclaiming the 1.3600 figure after solid Canadian economic data increased the odds for further tightening by the Bank of Canada (BoC). Nevertheless, recent data in the United States (US), alongside a risk-off impulse, cushioned the pair’s fall and trades at 1.3584, down by 0.10%.

Canada’s economy growing faster than estimates, takes a potential rate hike back into the table for the BoC

Statistics Canada reported that Gross Domestic Product (GDP) for the first quarter (Q1) rose above estimates, accelerating further in April, according to data. The Canadian economy expanded by 3.1% YoY, smashing 2.5% estimates, and month-over-month (MoM) in March stood at 0%, against the above forecasts—the preliminary figure for April stood at 0.2%.

After the data was released, the USD/CAD tumbled from around 1.3640 toward 1.3606 before data from the US sponsored a short-lived recovery.

In the US, the April job openings report, known as JOLTs, unexpectedly soared to its highest level in three months, justifying the need for additional interest rate hikes by the US Federal Reserve (Fed). Vacancies grew to 10.1M, above estimates of 9.375M, and posted more than 300K compared to March. Although it cushioned the USD/CAD fall and reclaimed 1.3600, the pair extended its losses below the latter.

The greenback stood afloat as falling crude oil prices threw a lifeline, as it extended its losses by 1.32%, with the US crude oil benchmark, WTI exchanging hands at $68.53 per barrel.

Meanwhile, the US Dollar Index (DXY), which tracks the buck’s value vs. a basket of six peers, stands at 0.48%, up at 104.557, bolstered by recently released jobs data and increasing odds for another rate hike in June. The CME FedWatch Tool’s chances for an increase lie at 69.8%, above yesterday’s 66.6%.

USD/CAD Price Analysis: Technical outlook

USD/CAD Daily chart

From a technical perspective, the USD/CAD persists upward biased, despite the ongoing pullback, with sellers eyeing a test of the weekly low of 1.3567. Further deep beneath that level will immediately expose the 20-day Exponential Moving Average (EMA) at 1.3542, followed by the 50-day EMA at 1.3530. Conversely, if USD/CAD buyers reclaim 1.3600, that will exacerbate a continuation of the ongoing rally, but a decisive break above the weekly high of 1.3651 is needed to challenge 1.3700.

Full Article

Colombia National Jobless Rate: 10.7% (April) vs 10%

Colombia National Jobless Rate: 10.7% (April) vs 10%

316543   May 31, 2023 23:29   FXStreet   Market News  

Information on these pages contains forward-looking statements that involve risks and uncertainties. Markets and instruments profiled on this page are for informational purposes only and should not in any way come across as a recommendation to buy or sell in these assets. You should do your own thorough research before making any investment decisions. FXStreet does not in any way guarantee that this information is free from mistakes, errors, or material misstatements. It also does not guarantee that this information is of a timely nature. Investing in Open Markets involves a great deal of risk, including the loss of all or a portion of your investment, as well as emotional distress. All risks, losses and costs associated with investing, including total loss of principal, are your responsibility. The views and opinions expressed in this article are those of the authors and do not necessarily reflect the official policy or position of FXStreet nor its advertisers. The author will not be held responsible for information that is found at the end of links posted on this page.

If not otherwise explicitly mentioned in the body of the article, at the time of writing, the author has no position in any stock mentioned in this article and no business relationship with any company mentioned. The author has not received compensation for writing this article, other than from FXStreet.

FXStreet and the author do not provide personalized recommendations. The author makes no representations as to the accuracy, completeness, or suitability of this information. FXStreet and the author will not be liable for any errors, omissions or any losses, injuries or damages arising from this information and its display or use. Errors and omissions excepted.

The author and FXStreet are not registered investment advisors and nothing in this article is intended to be investment advice.

Full Article

Euro sink to a fresh two-month low

Euro sink to a fresh two-month low

316542   May 31, 2023 23:26   Forexlive Latest News   Market News  

The euro is at a new session low, down 83 pips to 1.0651. The pair had attempted to find support at the early-European low of 1.0660 and bounced from there but the selling resumed in the last 20 minutes.

Month-end flows have been a factor this week but the economic data largely tells the story.

Today’s German CPI reading for May was 6.1% y/y compared to 6.5% expected. In the US, JOLTS job openings unexpectedly rose to 10.1m versus 9.38m expected. There is considerably more labor slack in Europe compared to the US and that may limit ECB hikes and lead to earlier cuts. Meanwhile, the US economy continues to hold up better than anticipated.

If that trend holds, the euro will soon be challenging the January-March double bottom. A big factor in that will be the FOMC decision on June 14 and the US CPI report a day before.

Full Article

MATIC price likely to benefit from Polygon’s partnership with the world’s largest Telecom giant

MATIC price likely to benefit from Polygon’s partnership with the world’s largest Telecom giant

316540   May 31, 2023 23:26   FXStreet   Market News  


Share:

  • Polygon secured a partnership with Deutsche Telekom, with the giant joining MATIC network as a validator. 
  • The collaboration between the Layer-2 scaling platform and the world’s leading telecommunications provider is bullish for the Polygon ecosystem. 
  • Polygon’s native token MATIC yielded 3% gains for holders over the past two weeks. 

Polygon, Ethereum’s largest Layer-2 scaling solution, entered a partnership with Deutsche Telekom, a telecommunications giant. The firm joined the Polygon ecosystem as a validator.

Also read: Ethereum holders pull $1 billion in ETH off exchanges hinting retail-led rally

Polygon and Deutsche Telekom enter partnership 

Polygon network has garnered support from one of the largest telecommunications giants worldwide. Deutsche Telekom has expanded its activities into blockchain technology and extended support to the MATIC ecosystem, joining the network as a validator. 

The Polygon network has 100 validators and the telecommunications giant is now one of them, supporting the MATIC network and strengthening its security. Dirk Röder, Head of the Blockchain Solutions Center at Deutsche Telekom, was quoted as saying,

The collaboration with Polygon is an important step for Deutsche Telekom MMS to fully exploit the potential of blockchain technology…Deutsche Telekom MMS also supports Polygon staking, contributing to the security and decentralization of the blockchain.

How this partnership could catalyze MATIC price recovery?

MATIC is the native token of the Polygon ecosystem. A partnership with the telecom giant is likely to fuel a bullish sentiment among MATIC holders and catalyze the token’s recovery. At press time, MATIC price is $0.8869 and the Layer-2 scaling token has yielded upwards of 3% gains for holders over the past two weeks. 

MATIC/USD price chart on CoinGecko

MATIC/USD price chart on CoinGecko

The altcoin is likely to attempt recovery to its weekly high of $0.9491 in its upward trajectory.

Full Article

Gold Price Forecast: XAU/USD jumps to weekly highs near $1,975

Gold Price Forecast: XAU/USD jumps to weekly highs near $1,975

316539   May 31, 2023 23:09   FXStreet   Market News  


Share:

  • Gold prices rise slide in Wall Street, supported by a decrease in government bond yields.
  • Following a brief pullback in response to the US Job Openings report, XAU/USD rebounded to weekly highs.

Gold prices are up for the second consecutive day on Wednesday, driven by lower government bond yields. The yellow metal reached its highest level in a week and is trading above $1,970. 

Gold keeps shinning

After the opening bell on Wall Street, XAU/USD gained momentum and rose above $1,970. However, following the release of the US Job Openings report, it pulled back to $1,960, only to rebound later to $1,974, hitting a fresh weekly high.

US data released so far on Wednesday has been mixed. The JOLTS Job Openings came in at 10.10 million in April, against expectations of a decrease to 9.73 million. Meanwhile, the Chicago PMI showed a sharp decline in May from 48.6 to 40.4, against expectations of 47. These economic figures triggered market volatility. On Thursday, the ADP Employment report and the weekly Jobless Claims are due, while on Friday, the official Employment report will be released.

Although the US Dollar Index is up by 0.45%, it is not limiting Gold’s gains. The key driver on Wednesday has been government bond yields. The 10-year Treasury yield is at 3.65%, the lowest in more than a week, while the German 10-year reference dropped to 2.24%, the lowest in two weeks. Market jitters and easing inflation in Europe are supporting the rally in bonds.

The short-term outlook for Gold looks positive while trading above $1,955, with resistance expected around $1,970. A clear consolidation above this level would keep the door open for further gains. The next strong resistance could be seen at the 20 and 55-day Simple Moving Averages, currently at $1,988.

Technical levels 


Full Article

Gold Price Forecast: XAU/USD to peak at $2,050 by Q1 2024 and then ease back to $2,000 – Crédit Agricole

Gold Price Forecast: XAU/USD to peak at $2,050 by Q1 2024 and then ease back to $2,000 – Crédit Agricole

316538   May 31, 2023 23:02   FXStreet   Market News  


Share:

Strategists at Crédit Agricole have made an upward revision to their Gold price forecast for 2024.

Three factors behind the revised outlook

“We now expect Gold to peak at $2,050 by Q1 2024 and then ease back to $2,000 by the end of Q2 2024. We continus to hold our previous target of $2,000 for the precious metal by the end of 2023.”

“The ongoing US debt-ceiling debacle has prompted investors to flock to Gold, viewing it as a safe haven and a reserve asset in times of uncertainty. Gold has historically performed well during past debt ceiling incidents, often holding onto and even extending its gains in the months following a debt ceiling resolution.”

“US political risks could continue to boost Gold’s appeal, even after the current debt ceiling issue is resolved. If the statutory debt limit is extended until January 2025, the ensuing political wrangling could amplify risks surrounding the 2024 US presidential election.”

“We predict a weakening USD in late 2023 and early 2024, due to expectations of the Federal Reserve entering an easing cycle amidst a potential US recession and subsiding inflation. This scenario is likely to further enhance Gold’s attractiveness.”

Full Article

Oil price plummets on debt-ceiling doubts, China factory data

Oil price plummets on debt-ceiling doubts, China factory data

316535   May 31, 2023 22:56   FXStreet   Market News  


Share:

  • Oil price spirals lower as traders deleverage ahead of the key vote to decide whether the US should raise its debt limit.
  • A growing number of Republican Congressmen especially, have voiced their disapproval of the deal and said they intend to vote it down. 
  • Poor factory data from China, Oil’s largests importer, shows stunted manufacturing growth further weighing on Oil price.

Oil price tumbles on Wednesday as doubts grow over whether the deal to raise the US debt ceiling will get voted through by Congress. A group of rebel Republicans and some Democrats too have warned they may vote against the deal. If it fails to pass and the US defaults on its obligations, financial chaos is expected, hitting Oil demand and lowering prices. That said, the US Dollar could also suffer – a positive for Oil, which is priced mainly in USD. Below-expectations data from China, the world’s largest consumer of Oil, raising fears it has still not bounced back from lockdown also weigh. 

At the time of writing, WTI Oil is trading in the mid $68s and Brent Crude Oil in the lower $73s.  

Oil news and market movers 

  • Oil price loses ground as investors question whether the tentative agreement to extend the debt limit, reached by President Joe Biden and Republican House Speaker Kevin McCarthy over the weekend, will win enough votes in Congress to pass into law.
  • The House of Representatives is expected to vote on the deal on Wednesday evening before it goes to the Senate for the final vote. 
  • Several House Republicans have voiced displeasure at the idea of increasing the country’s already gigantic debt pile. Some Democrats are also opposed to the bill because it cuts benefits. Democrat Congressman Richie Torres, for example, has criticized cuts to disability benefits.  
  • Official data from China dissapoints with the official NBS Manufacturing PMI falling to a deeper-than-expected 48.8 in May from 49.4 in April when it had been expected to come out at 49.2. This further weighed on Oil since China is the commodity’s largest importer so the health of its economy is a factor influencing its price. 
  • Expectations that an eleventh-hour agreement will be reached on the debt ceiling as well as robust US macroeconomic data have increased market expectations that the Federal Reserve (Fed) will have to raise interest rates to combat rising inflation expectations – bullish for the US Dollar; bearish for Oil.  
  • At the time of writing, the CME FedWatch tool shows the odds continue to favor (by around 60%) the Fed raising interest rates by 0.25% at their meeting on June 14.  
  • Oil traders await the outcome of the next OPEC+ meeting on June 4, when the possibility of production cuts has been mooted.  
  • Two of OPEC+’s largest members, however, seem to be giving divergent messages over what might be decided. 
  • Saudi Oil Minister Prince Abdulaziz bin Salman seemed to imply OPEC+ might cut production quotas last Tuesday, May 24, when he warned speculators (interpreted as short-sellers) to “watch out”, and expressed support for OPEC’s October decision to cut supply. 
  • On the other hand, Russia’s Energy Minister Alexander Novak, played down the idea of production cuts, saying “I don’t think that there will be any new steps, because just a month ago certain decisions were made regarding the voluntary reduction of oil production by some countries.” 

Crude Oil Technical Analysis: Price falls back in line with long-term downtrend

WTI Oil price paints more red on the charts as it falls back in line with the dominant downtrend, which has made successive lower lows since July 2022. As the old adage goes, “the trend is your friend until the bend at the end,” which given it is bearish favors short sellers. WTI Oil is trading below all the major daily and weekly Simple Moving Averages (SMAs) and is now also testing the 200-week SMA at $66.90. 


WTI US Oil: Weekly Chart

The potentially bullish right-angled triangle, which formed during May and is shown by the dotted lines on the daily chart below, failed to breakout higher and instead broke lower. 

WTI US Oil: Daily Chart

Oil price has decisively broken below the May 22 lows of $70.65 as well as the $69.40 May 15 lows. Only the 200-week SMA now stands in the way of further losses. If it breaks too, it could lead to further weakness down to the year-to-date (YTD) lows of $64.31. 

A break below the YTD lows would reignite the downtrend, with the next target at around $62.00, where trough lows from 2021 will come into play, followed by support at $57.50.

Oil price needs to climb back above the $74.70 May 24 highs to raise doubts about the dominant bearish trend. 

Such a break might lead to a potential target in the $79.70s, which roughly coincides with the 200-day SMA and the main trendline for the bear market, heightening its importance as a key resistance level. 

The long hammer Japanese candlestick pattern that formed at the May 4 (and YTD) lows is a sign that Oil price may have formed a strategic bottom at that level. 
 

Brent Crude Oil FAQs

What is Brent Crude Oil?

Brent Crude Oil is a type of Crude Oil found in the North Sea that is used as a benchmark for international Oil prices. It is considered ‘light’ and ‘sweet’ because of its high gravity and low sulfur content, making it easier to refine into gasoline and other high-value products. Brent Crude Oil serves as a reference price for approximately two-thirds of the world’s internationally traded Oil supplies. Its popularity rests on its availability and stability: the North Sea region has well-established infrastructure for Oil production and transportation, ensuring a reliable and consistent supply.

What factors drive the price of Brent Crude Oil

Like all assets supply and demand are the key drivers of Brent Crude Oil price. As such, global growth can be a driver of increased demand and vice versa for weak global growth. Political instability, wars, and sanctions can disrupt supply and impact prices. The decisions of OPEC, a group of major Oil-producing countries, is another key driver of price. The value of the US Dollar influences the price of Brent Crude Oil, since Oil is predominantly traded in US Dollars, thus a weaker US Dollar can make Oil more affordable and vice versa.

How does inventory data impact the price of Brent Crude Oil

The weekly Oil inventory reports published by the American Petroleum Institute (API) and the Energy Information Agency (EIA) impact the price of Brent Crude Oil. Changes in inventories reflect fluctuating supply and demand. If the data shows a drop in inventories it can indicate increased demand, pushing up Oil price. Higher inventories can reflect increased supply, pushing down prices. API’s report is published every Tuesday and EIA’s the day after. Their results are usually similar, falling within 1% of each other 75% of the time. The EIA data is considered more reliable, since it is a government agency.

How does OPEC influence the price of Brent Crude Oil

OPEC (Organization of the Petroleum Exporting Countries) is a group of 13 Oil producing nations who collectively decide production quotas for member countries at twice-yearly meetings. Their decisions often impact Brent Crude Oil prices. When OPEC decides to lower quotas, it can tighten supply, pushing up Oil prices. When OPEC increases production, it has the opposite effect. OPEC+ refers to an expanded group that includes ten extra non-OPEC members, the most notable of which is Russia.

Full Article

USD/BRL: Real weakness could hasten if government tries to influence monetary policy – Commerzbank

USD/BRL: Real weakness could hasten if government tries to influence monetary policy – Commerzbank

316534   May 31, 2023 22:51   FXStreet   Market News  


Share:

The Brazilian Real depreciated again yesterday after further inflation indicators signaled a faster decline in inflation. The showdown between the Brazilian government and the central bank (Banco Central do Brasil, BCB) is getting closer. Economists at Commerzbank analyze its implication for the USD/BRL pair. 

August meeting of the BCB is looking more and more like the date for a first rate cut

“In June, the planning minister, finance minister and central bank governor will meet to set the inflation target for 2026. BCB governor Campos Neto has recently repeatedly warned against changes, stressing that they would not widen the current scope for rate cuts.”

“We also see the discussions as a potentially destabilizing factor for the Brazilian Real. The August meeting of the BCB is looking more and more like the date for a first rate cut. At the same time, the Fed’s rate cut expectations are being pushed further into the future. No wonder the USD/BRL exchange rate is trending higher.”

“However, if discussions about inflation targeting leave even the slightest doubt that the government is trying to influence monetary policy in this way, BRL weakness could quickly take on much greater proportions.”

Full Article

EUR/USD can sink further in the coming weeks – Rabobank

EUR/USD can sink further in the coming weeks – Rabobank

316533   May 31, 2023 22:33   FXStreet   Market News  


Share:

EUR/USD has today sunk to its lowest levels since mid-March. Economists at Rabobank discuss the pair’s outlook for the coming weeks.

USD is likely to find support amid risk-averse environment

“The currency pair is comfortably on course for hitting our H2 target of EUR/USD 1.06.” 

“The market is already comfortably priced for further rate hikes and moderating price data and the threat that the Eurozone is facing stagnation in H2 suggest that the EUR can sink further vs. the USD in the coming weeks.”

“The risk that the US may fall in recession this year, combined with a disappointing recovery in China and stagnation risks in the Eurozone do not bode well for risk appetite. In this environment the USD is likely to find support.”

Full Article

US dollar jumps after strong job openings report

US dollar jumps after strong job openings report

316532   May 31, 2023 22:26   Forexlive Latest News   Market News  

It’s all about the data today. In the past hour, we’ve seen the dollar drop on poor manufacturing data only to jump right back on strong job openings numbers.

GBP/USD shows the round trip.

That chart arguably understates the magnitude of the moves. On most charts, the US dollar is above where it was before the manufacturing data, as the Fed is more-inclined to be swayed by the JOLTS numbers.

Fed rate hike odds now rest at about 66% compared to 61% at the start of the day.

Full Article

Rewind