Market News

Forex Market News .. collected from serval sources, all in one place for you to review.
[most entries here, will be auto-removed after 90 days]

How to trade oil: Bearish 1st target hit before bulls took control above $90.90

Key takeaways from today's WTI crude oil reversal

  • The original bearish scenario reached its first target at $89.58, but did not continue to the second target at $88.67.
  • The move to $89.57 failed quickly, with the same 30-minute candle closing back near $90.55.
  • The bullish tradeCompass scenario later activated above $90.90.
  • All four bullish targets at $91.14, $91.28, $91.80 and $92.46 were reached.
  • WTI subsequently extended to $93.14, approximately $2.24 above the bullish activation level.
  • The directional score has shifted from -4 to +5 on a -10 to +10 scale.

This follow-up refers to the original WTI crude oil tradeCompass analysis, which mapped both a bearish scenario below $90.00 and an opposing bullish scenario above $90.90.

What happened to…
Read source

Sometimes the best trade you can do is to simply do nothing

We've all been there before. When you're in the market, trading often times creates the pressure to act. It's just how it is.

Prices move ever so quickly in markets and headlines flash across the screens in an instant. You then see big moves on the charts and people talking all about it everywhere. Even more so in this day and age when everything is amped up by social media, dialing things up from zero to ten in no time and promoting the fear of missing out.

It creates an impression that if you are not buying or selling something, you are falling behind.

However, it's always important to take a step back or perhaps even to just take a walk. Step away from the screens and just remember, trading is not a competition of who can press buttons…

Read source

Oil prices trade at the highest levels since June as US-Iran war intensifies. What’s next?

FUNDAMENTAL OVERVIEW


The recent rally in oil prices has been driven by a sharp re-escalation in the Middle East, involving once again the Strait of Hormuz. The US carried out new strikes against Iranian targets after alleged attacks on commercial shipping and US personnel, while Iran has threatened to disrupt Gulf oil exports and has taken a more aggressive posture in Hormuz.

The move higher was about the increase in risk premium, specifically about the perceived time extension of the conflict. As you recall, at the beginning of August, it looked like things were finally starting to ease and military actions were set aside. This week, the expectations changed as a…

Read source

Global Bond Selloff: Why Yields Are Surging and Why Investors Shouldn’t Abandon Bonds

Global bond markets are facing one of their sharpest repricings in years. The selloff accelerated on Tuesday, September 1, and extended into Wednesday as investors confronted a combination of renewed inflation risks, higher oil prices, deteriorating fiscal positions and expectations that central banks may have to keep monetary policy tighter for longer.

The scale of the move is striking. The U.S. 10-year Treasury yield climbed to around 4.81%, close to a three-year high, with a move toward 5% increasingly viewed as possible. Japan's 10-year government bond yield moved above 3%, its highest level in 30 years, while Australia's 10-year yield reached 5.198%, a more than 15-year high. In Europe, German Bund futures fell to their lowest level…

Read source

IC – Europe Fundamental Forecast | 03 September 2026

IC – Europe Fundamental Forecast | 03 September 2026

What happened in the Asia session?

Stronger Chinese services activity and Japanese services growth have provided a positive macro backdrop, but the biggest currency story remains the Japanese yen’s sharp appreciation as markets increasingly price the possibility of additional BoJ tightening. At the same time, U.S.–Iran tensions continue to keep crude oil near $95, maintaining an inflation risk that could influence global central-bank expectations. Asian equities have consequently recovered from Wednesday’s selloff, while gold retains safe-haven support.

What does it mean for the Europe & US sessions?

The European session will be heavily influenced by Eurozone inflation at 3.3% and…

Read source

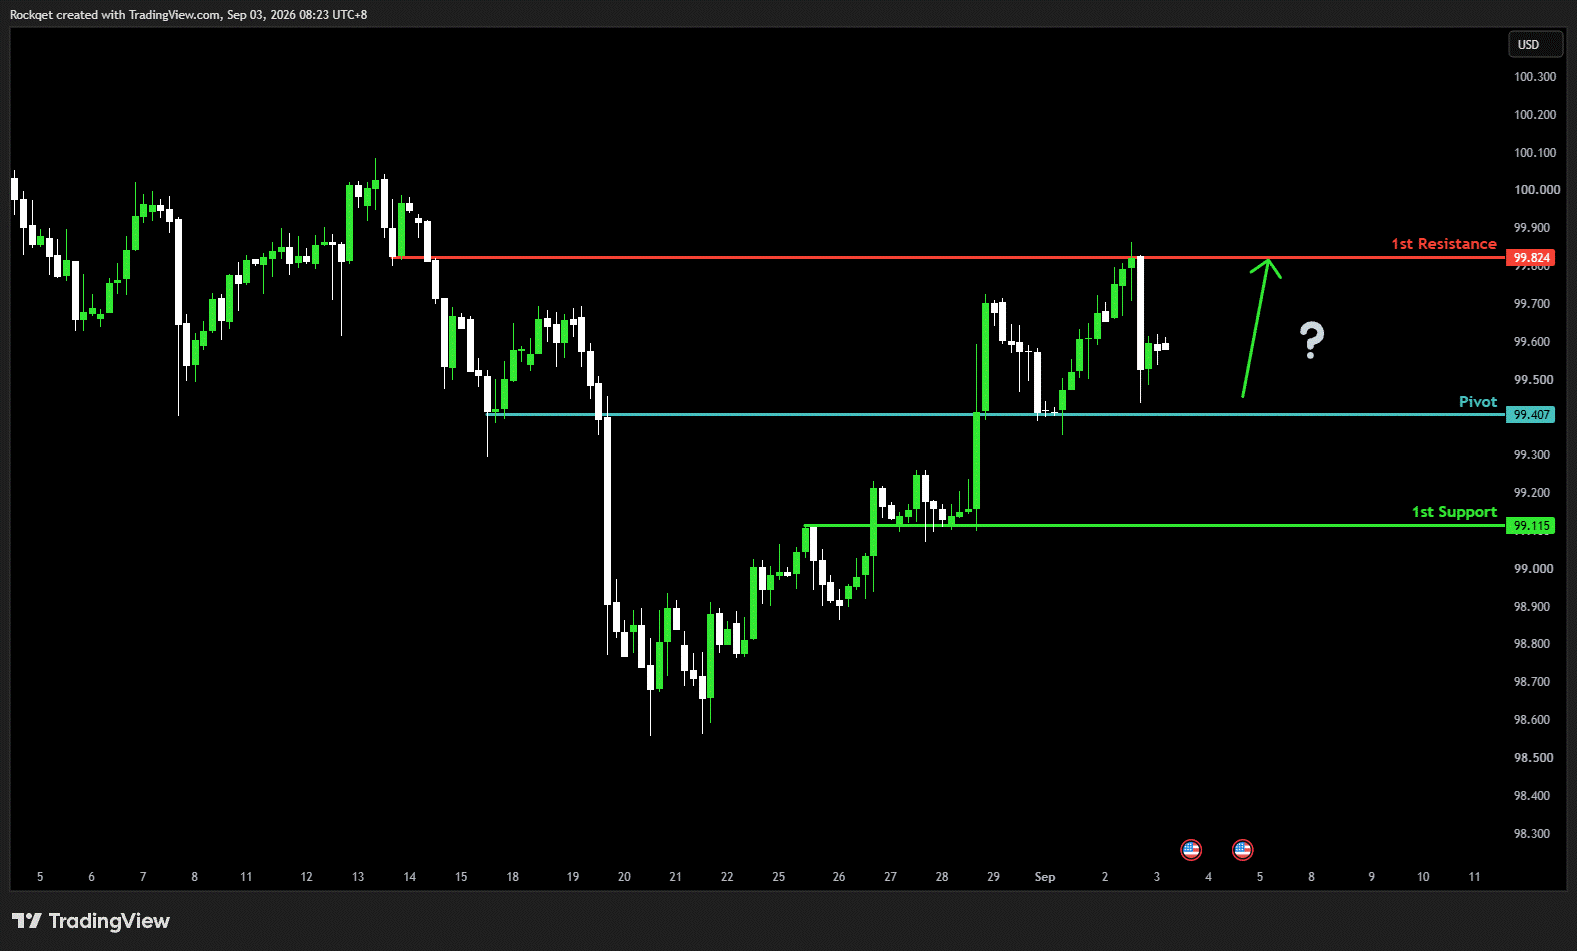
Thursday 3rd Sept 2026: Technical Outlook and Review

    DXY (U.S. Dollar Index):

Potential Direction: Bullish

Overall momentum of the chart: Bearish

The price could make a short-term pullback toward the pivot before rising again toward the 1st resistance

Pivot: 99.40

Supporting reasons: Identified as an overlap support, where renewed buying pressure could emerge to push the price higher.

1st support: 99.11

Supporting reasons: Identified as an overlap support, indicating a potential area where the price could again stabilize.

1st resistance: 99.82
Supporting reasons: Identified as an overlap resistance, indicating a potential area that could halt any further upward movement

EUR/USD:

Potential Direction: Bullish

Overall momentum of the chart:…

Read source

Gold upside remains limited by Fed rate hike risks and Iran war; traders await US CPI for next direction

FUNDAMENTAL OVERVIEW


Gold erased completely the Treasury buyback announcement gains after Fed Chair Warsh retightened financial conditions with his hawkish speech at the Jackson Hole Symposium. Since yesterday, we’ve started to see pullbacks across many markets as the hawkish repricing run its course and things stabilised.

The US CPI report next Friday remains the key risk event that could influence interest rate expectations and decide the next direction for gold. As of now, traders are seeing a 58% chance of a rate hike in September.

I think only a soft CPI could bring the probabilities below 50% and deter the Fed from hiking at the upcoming meeting. If the probabilities…

Read source

General Market Analysis – 03/09/26

Stocks Find Support Despite Ongoing Tensions in the Gulf – Dow up 0.5%

US equities recovered some of their recent losses in trading yesterday as investors looked for value despite further hostilities in the Middle East. The Dow Jones rose 0.56% to 53,061, while the S&P 500 gained 0.46% to 7,666 and the Nasdaq advanced 0.45% to 26,217.

Treasury yields eased from their recent highs, with the US 2-year yield falling 3.1 basis points to 4.369%, while the 10-year yield declined 2.0 basis points to 4.778%. The pullback in yields also weighed on the US dollar, with the USD Index falling 0.12% to 99.56 as the greenback weakened against the major currencies.

Oil prices continued to push higher as markets priced in the risk of further…

Read source

IC – Asia Fundamental Forecast | 03 September 2026

IC – Asia Fundamental Forecast | 03 September 2026

What happened in the U.S. session?

Weaker-than-expected ADP employment data increased concerns about a slowing labour market and initially weighed on the dollar, while renewed U.S.–Iran tensions pushed oil higher and kept inflation fears alive.

Elevated Treasury yields continued to pressure gold and rate-sensitive assets, while equities remained relatively resilient thanks to strong AI-related sentiment. For the next session, U.S. Unemployment Claims and ISM Services PMI are the key releases to watch, with stronger-than-expected data likely supporting the USD and yields, while weaker data could reinforce expectations for easier Fed policy.

What does it mean for the Asia Session?

The main…

Read source

South Africa’s Heritage Day Holiday Trading Schedule 2026

Dear Client,

Please find our updated Trading schedule and general information related to the Heritage Day holiday  on Thursday, 24 September, 2026.

Liquidity over the holidays is expected to be particularly thin so please take the necessary precaution to ensure that you are not affected by increased volatility, spreads and intermittent pricing.

All times mentioned below are Platform time (GMT +3).

Kind regards,

IC Team.

The post South Africa’s Heritage Day Holiday Trading Schedule 2026 first appeared on IC Your Trading Edge | Official Blog.

Read source