Market News

Forex Market News .. collected from serval sources, all in one place for you to review.
[most entries here, will be auto-removed after 90 days]

US February NFIB small business optimism index 98.8 vs 99.6 expected

  • Prior 99.3
  • Full report here

This is a minor setback but the index remains above its 52-year average of 98. This is not a market moving report and it certainly won't be now that the focus is solely on the US-Iran war.

NFIB Chief Economist Bill Dunkelberg said: "Although optimism declined slightly, small businesses report feeling more certain in February as they look toward the coming months. High sales and increased profits made February a more positive month for many owners, but competition from large businesses is putting stress on Main Street firms as they navigate the current economic climate. Labour quality and sales improved."

The NFIB Small Business Optimism Index is a monthly economic indicator that measures the "pulse" of small…

Read source

IC Markets Global – Europe Fundamental Forecast | 10 March 2026

IC Markets Global – Europe Fundamental Forecast | 10 March 2026

What happened in the Asia session?

Asian markets traded mixed-to-higher as China’s blockbuster trade surplus ($213.62B, exports +21.8%) offset soft imports and supported risk sentiment, while Japan’s below-consensus GDP (0.1% QoQ) lifted Nikkei 225 +3.26% and yen; most impacted were JPY pairs, AUD (China trade sensitivity), Nikkei exporters, and Hang Seng tech amid global cues.

What does it mean for the Europe & US sessions?

Traders should monitor escalating Middle East tensions, particularly U.S.-Iran conflicts, driving oil prices toward triple digits (Brent nearing $100/barrel) and boosting safe-haven demand for gold near $5,100/oz, while pressuring equities and…

Read source

Tuesday 10th March 2026: Technical Outlook and Review

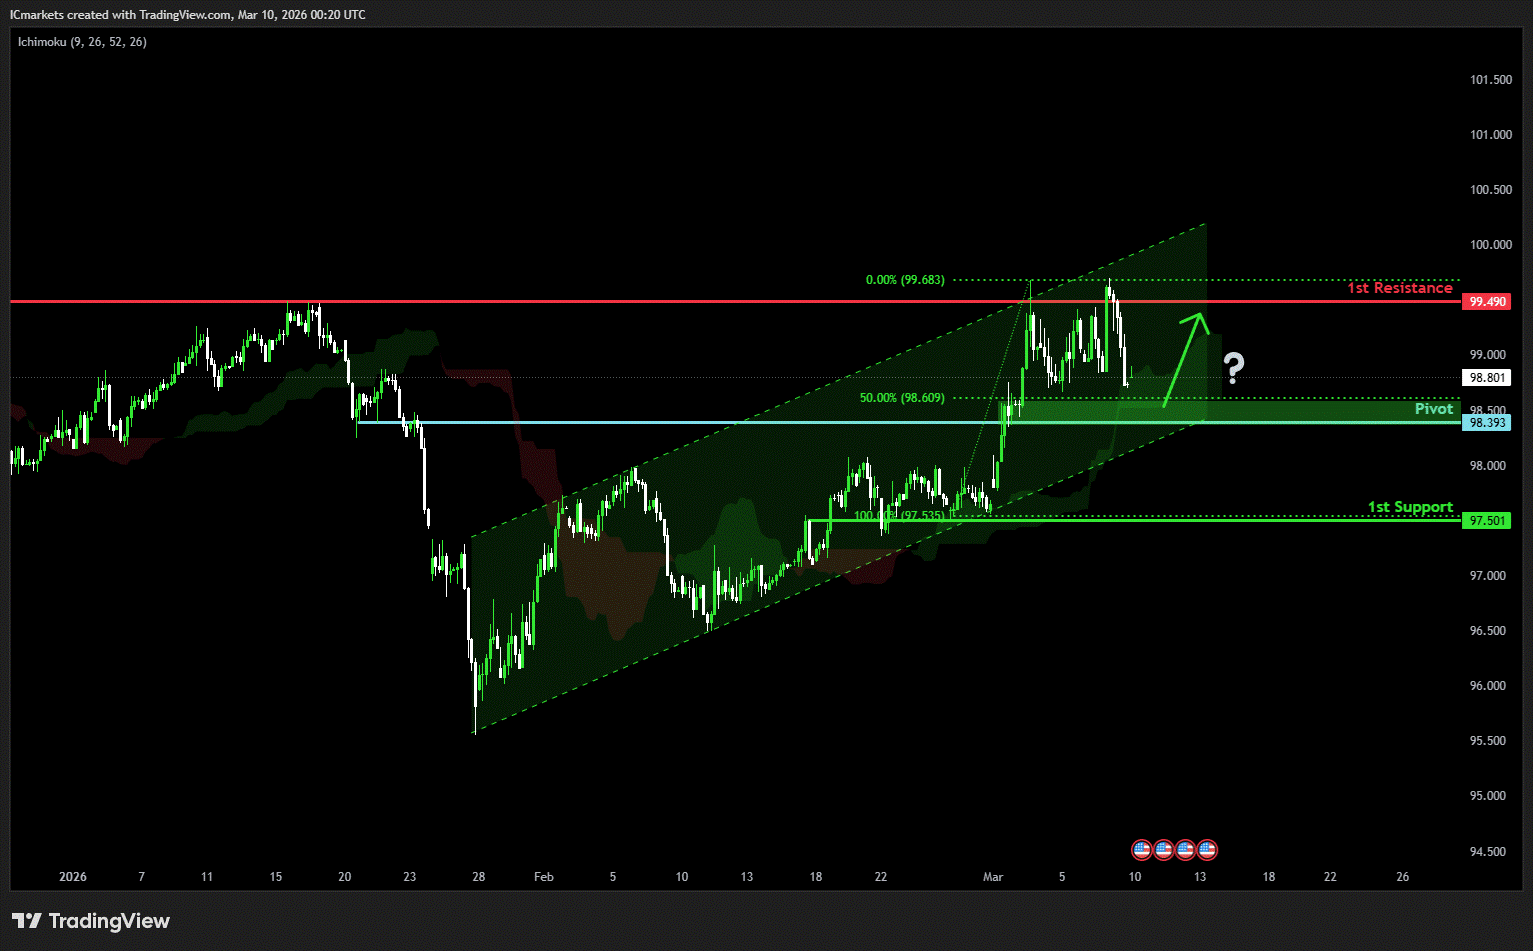
  DXY (U.S. Dollar Index):

Potential Direction: Bullish

Overall momentum of the chart: Bearish

The price could see a short-term pullback toward the pivot before rising again toward the 1st resistance.

Pivot: 98.39

Supporting reasons: Identified as a pullback support that aligns with the 50% Fibonacci retracement, where renewed buying pressure could emerge to push the price higher.

1st support: 97.50

Supporting reasons: Identified as an overlap support, indicating a potential area where the price could again stabilize.

1st resistance: 99.49
Supporting reasons: Identified as an overlap resistance, indicating a potential area that could halt any further upward movement

EUR/USD:

Potential Direction:…

Read source

Tuesday 10th March 2026: Technical Outlook and Review

  DXY (U.S. Dollar Index):

Potential Direction: Bullish

Overall momentum of the chart: Bearish

The price could see a short-term pullback toward the pivot before rising again toward the 1st resistance.

Pivot: 98.39

Supporting reasons: Identified as a pullback support that aligns with the 50% Fibonacci retracement, where renewed buying pressure could emerge to push the price higher.

1st support: 97.50

Supporting reasons: Identified as an overlap support, indicating a potential area where the price could again stabilize.

1st resistance: 99.49
Supporting reasons: Identified as an overlap resistance, indicating a potential area that could halt any further upward movement

EUR/USD:

Potential Direction:…

Read source

Tuesday 10th March 2026: Asian Markets Rise on Wall Street Cues and Easing Iran Tensions

Global Markets:
  •  Asian Stock Markets : Nikkei up 1.60%, Shanghai Composite up 0.39%, Hang Seng up 1.48% ASX up 0.72%
  • Commodities : Gold at $5,164.46 (1.20%) Silver at $88.230 (4.40%), Brent Oil at $94.94 (-4.04%), WTI Oil at $91.07 (-3.96%)
  • Rates : US 10-year yield at 4.210, UK 10-year yield at 4.6540, Germany 10-year yield at 2.8649
News & Data:
  • (JPY) Leading Indicators 112.4%  to 113.0%  expected
Markets Update:  

Asian stock markets traded mostly higher on Tuesday, supported by positive cues from Wall Street overnight and easing geopolitical concerns. Investor sentiment improved after U.S. President Donald Trump suggested that the U.S. conflict with Iran could end soon, stating that Iranian forces had lost…

Read source

Tuesday 10th March 2026: Asian Markets Rise on Wall Street Cues and Easing Iran Tensions

Global Markets:
  •  Asian Stock Markets : Nikkei up 1.60%, Shanghai Composite up 0.39%, Hang Seng up 1.48% ASX up 0.72%
  • Commodities : Gold at $5,164.46 (1.20%) Silver at $88.230 (4.40%), Brent Oil at $94.94 (-4.04%), WTI Oil at $91.07 (-3.96%)
  • Rates : US 10-year yield at 4.210, UK 10-year yield at 4.6540, Germany 10-year yield at 2.8649
News & Data:
  • (JPY) Leading Indicators 112.4%  to 113.0%  expected
Markets Update:  

Asian stock markets traded mostly higher on Tuesday, supported by positive cues from Wall Street overnight and easing geopolitical concerns. Investor sentiment improved after U.S. President Donald Trump suggested that the U.S. conflict with Iran could end soon, stating that Iranian forces had lost…

Read source

General Market Analysis – 10/03/26

US Stocks Close Higher on Peace Hopes – Nasdaq up 1.4%
Financial markets experienced another highly volatile trading session overnight, with sharp swings across financial products as investors reacted to ongoing developments in the conflict in the Middle East. Despite significant intraday losses earlier in the session, US equity markets recovered strongly to close in positive territory after comments from President Trump raised hopes that the conflict could be approaching a resolution. The Dow Jones finished the day up 0.50% to close at 47,740, while the S&P 500 gained 0.83% to close at 6,795, while the tech-heavy Nasdaq rose 1.38% to close at 22,695. Currency markets also experienced choppy conditions throughout the session. The US dollar…

Read source

IC Markets Global – Asia Fundamental Forecast | 10 March 2026

IC Markets Global – Asia Fundamental Forecast | 10 March 2026

What happened in the U.S. session?

markets digested a steady 3.1% U.S. consumer inflation expectations print alongside an aggressive continuation of the conflict‑driven oil spike, which kept stagflation fears front and center. WTI and Brent pushed further toward and above the mid‑90s/near‑100 area, hammering U.S. equity futures, particularly tech, while supporting U.S. yields and the dollar and sustaining elevated gold prices on safe‑haven demand.

What does it mean for the Asia Session?

Escalating Middle East tensions, particularly the US-Iran conflict, have driven oil prices above $100 per barrel and sparked volatility in equities and safe-haven assets like gold. Regional…

Read source

China exports surge 21.8% as trade surplus widens at start of 2026 – more detail

China exports surge at start of 2026 as trade surplus widens sharply.

Summary:

  • China’s exports surged 21.8% y/y in January–February, far exceeding expectations and accelerating sharply from December’s 6.6% growth.

  • The country recorded a $213.6B trade surplus, well above forecasts and last year’s level.

  • Imports also jumped 19.8% y/y, suggesting stronger trade flows despite weak domestic demand.

  • China’s export strength continues despite renewed U.S. tariffs, with manufacturers shifting shipments toward emerging markets.

  • Energy trade data showed crude imports up 15.8%, while refined product exports rose and natural gas imports edged lower.

  • Large stockpiles and diversified supply chains may help China weather global energy disruptions tied to…

Read source

China’s trade data for January–February came in much stronger than expected

China’s trade data for January–February came in much stronger than expected.

  • Exports (USD terms) rose 21.8% y/y (expected 7.1%, previous 6.6%).

  • Imports (USD terms) increased 19.8% y/y (expected 6.3%, previous 5.7%).

  • Trade balance printed at $213.62B, well above the $179.6B forecast (previous $114.10B).

This article was written by Eamonn Sheridan at investinglive.com.
Read source