429939 April 29, 2026 16:00 ICMarkets Market News
Asia-Pacific markets opened mixed on Wednesday as investors reacted to overnight losses on Wall Street and assessed fresh developments involving OPEC and concerns about OpenAI’s financial outlook.
In a significant move for global energy markets, the United Arab Emirates announced it will exit OPEC on May 1, dealing a notable setback to the oil-producing alliance that coordinates output among several of the world’s largest exporters, especially in the Middle East. The decision added uncertainty to oil supply expectations and contributed to cautious market sentiment.
Technology stocks also faced pressure after a Wall Street Journal report indicated that OpenAI’s revenue and user growth were below internal targets. According to the report, Chief Financial Officer Sarah Friar warned company leadership that OpenAI could face challenges meeting its computing contract obligations if revenue growth does not accelerate.
Regionally, South Korea’s Kospi slipped 0.39%, while the Kosdaq traded flat. Australia’s S&P/ASX 200 declined 0.28%. In contrast, Hong Kong’s Hang Seng index gained 1.2%, while mainland China’s CSI 300 edged down 0.26%. Japanese markets remained closed for a public holiday.
U.S. futures showed modest gains, but overnight trading saw the S&P 500 fall 0.49%, the Nasdaq Composite drop 0.9%, and the Dow Jones Industrial Average slip slightly as investors awaited major tech earnings and signals from the Federal Reserve’s policy meeting.
The post Wednesday 29th April 2026: Asia-Pacific Markets Mixed as OPEC Exit Shock and OpenAI Growth Concerns Weigh on Sentiment first appeared on IC Your Trading Edge | Official Blog.

429938 April 29, 2026 15:40 ICMarkets Market News
US Stocks Fall Ahead of FOMC – Nasdaq down 0.9%
US equity markets moved lower in the latest session, led by weakness in the tech sector as renewed concerns around AI-driven growth weighed on sentiment and traders looked ahead to today’s FOMC rate decision. The Nasdaq Composite fell 0.90% to close at 24,663, underperforming its peers and pulling back from recent record highs. The S&P 500 also declined, dropping 0.49% to 7,138, while the Dow Jones proved relatively resilient, edging just 0.05% lower to finish at 49,141. US Treasury yields gained ground again, the 2-year up 3.7 basis points to 3.836%, while the 10-year yield added 0.6 basis points to 4.346%. Currency markets saw the US Dollar Index strengthen modestly, with the DXY gaining 0.13% to 98.63 as it continued to trade within recent ranges ahead of key macroeconomic catalysts. In commodities, oil prices extended their rally amid ongoing geopolitical tensions centred around the Strait of Hormuz. Brent Crude rose 2.68% to $111.13 per barrel, while WTI gained 3.39% to $99.63, as supply concerns outweighed reports that the UAE is set to exit OPEC. Gold prices, however, came under heavy pressure, with gold falling 1.82% to $4,596.75 after breaking through key technical support levels, as higher yields and a firmer dollar weighed on the precious metal.
FOMC In Focus for Traders Today
Traders are again preparing for central bank updates to take precedence over geopolitics, however briefly, in the sessions ahead today, with the FOMC set to take centre stage as it makes its last rate call under the guidance of Chairman Jerome Powell. The market is nearly 100% pricing in a ‘no change’ call from the Fed; however, forward guidance from the world’s biggest central bank should see plenty of volatility across financial products. A more hawkish leaning in the statement and at the press conference could see pricing for rate hikes wiped off the board for this year, which could prompt a sharp correction in stocks, as well as strong rallies in Treasury yields and the greenback. A dovish outlook would open the way for fresh records in the indices and some downside moves for yields and the dollar.
Big Calendar Day Ahead for Markets – Inflation and Central Banks in Focus
Looking ahead to today’s trading session, markets face a heavy macroeconomic calendar on top of the ever-present threat of geopolitical updates from the stalemate in the Middle East. In the Asian session, attention will be firmly on antipodean markets, with RBNZ Governor Anna Breman set to speak early in the day before key Australian CPI (exp +1.3% m/m, +4.8% y/y) is released. The London session will have euro traders focusing on German CPI data, released throughout the day on a state-by-state basis. However, the New York session is likely to see the most volatility, with both North American central banks—the Bank of Canada and the Federal Reserve Bank—set to update the market on interest rates. Both are strongly expected to keep rates on hold at 2.25% and 3.75%, respectively, but moves are expected around both events based on the forward guidance given, with reverberations from the FOMC likely to continue through the following day.
Explore all upcoming market events in the Economic Calendar.
The post General Market Analysis – 29/04/26 first appeared on IC Your Trading Edge | Official Blog.
429937 April 29, 2026 15:40 ICMarkets Market News
IC Markets Global – Asia Fundamental Forecast | 29 April 2026
What happened in the U.S. session?
The U.S. financial landscape has been shaped by a focus on corporate earnings momentum, ongoing geopolitical tensions in the Middle East, and speculation surrounding upcoming Federal Reserve leadership changes. Markets have responded to these developments with cautious optimism, as evidenced by slight gains in the S&P 500 and Nasdaq 100, though oil markets remain sensitive to the U.S.-Iran impasse. Concurrently, U.S. Treasury yields have drifted higher as investors process the extension of a ceasefire in that region.
What does it mean for the Asia Session?
Asian traders should brace for oil‑driven volatility, with elevated crude and gold prices amplifying stress on net‑oil‑importing economies such as India, Indonesia, and the Philippines, while AI‑ and chip‑led strength continues to underpin North Asian indices. Key short‑term drivers include the Bank of Japan’s cautious stance, upcoming Australian CPI and Chinese PMI releases, and spillovers from US‑Iran geopolitical noise and Fed‑related dollar dynamics, all of which will influence FX, equities, and commodity flows during the Asian session.
The Dollar Index (DXY)
Key news events today
Federal Funds Rate (6:00 pm GMT)
FOMC Statement (6:00 pm GMT)
FOMC Press Conference (6:30 pm GMT)
What can we expect from DXY today?
The US dollar is holding in a defensive range around the high‑98s on the DXY, with the dominant focus on the FOMC decision and the messaging around future rate cuts rather than the policy rate itself; elevated US yields, sticky inflation, and renewed Middle‑East‑driven oil risk continue to underpin the greenback, while short‑term swings are being driven by risk sentiment and Fed‑speak around the timing and number of 2026 cuts.
Central Bank Notes:
Next 24 Hours Bias
Weak Bearish
Gold (XAU)
Key news events today
Federal Funds Rate (6:00 pm GMT)
FOMC Statement (6:00 pm GMT)
FOMC Press Conference (6:30 pm GMT)
What can we expect from Gold today?
gold maintains resilience near $4,688 amid a mix of de-escalating Middle East tensions, a firm dollar, and safe-haven demand, with traders watching for US-Iran compliance and potential Fed policy shifts; expect modest upside if peace holds, but volatility persists below the $4,930 resistance.
Next 24 Hours Bias
Medium Bullish
The Australian Dollar (AUD)
Key news events today
CPI m/m (1:30 am GMT)
CPI y/y (1:30 am GMT)
Trimmed Mean CPI m/m (1:30 am GMT)
What can we expect from AUD today?
The Australian Dollar continues its strong run, trading near recent four-year highs around 0.7188-0.72 USD amid optimism for RBA rate hikes, robust local labor data, and fading US-Iran tensions that curb USD strength and oil-driven inflation fears; year-to-date gains exceed 11%, positioning AUD as a G10 standout, though ASX softness and lingering geopolitics cap upside.
Central Bank Notes:
Next 24 Hours Bias
Medium Bullish
The Kiwi Dollar (NZD)
Key news events today
RBNZ Gov Breman Speaks (12:30 am GMT)
What can we expect from NZD today?
The New Zealand Dollar (NZD) showed limited movement following a slight depreciation the previous day. Recent reports indicate NZD/USD traded steadily around 0.5890 after slipping below that level on April 28, amid broader market caution influenced by US Dollar strength and ongoing global trade tensions.
Central Bank Notes:
Next 24 Hours Bias
Weak Bullish
The Japanese Yen (JPY)
Key news events today
No major news event
What can we expect from JPY today?
The Japanese Yen remained relatively stable against the USD at around 159.64, carrying forward momentum from the Bank of Japan’s April 28 policy hold at 0.75%—a decision with three hawkish dissents pushing for hikes amid elevated inflation risks from the Middle East conflict and higher oil prices, despite lowered growth outlooks; officials like Governor Ueda hinted at future tightening, and Finance Minister Katayama reiterated intervention readiness
Central Bank Notes:
Next 24 Hours Bias
Weak Bearish
Oil
Key news events today
EIA Crude Oil Inventories (8:30 pm GMT)
What can we expect from Oil today?
Oil prices remain elevated near three‑week highs, with Brent above 110 dollars per barrel and WTI near 100 dollars per barrel, driven by ongoing supply risks from the Strait of Hormuz closure and stalled US–Iran peace talks. Geopolitical uncertainty continues to dominate the market narrative, even as OPEC releases its new Annual Statistical Bulletin, which may provide fresh data on global supply‑demand balances but is unlikely to immediately offset the current risk‑premium backdrop.
Next 24 Hours Bias
Strong Bullish
The post IC Markets Global – Asia Fundamental Forecast | 29 April 2026 first appeared on IC Your Trading Edge | Official Blog.
429933 April 29, 2026 14:00 ICMarkets Market News

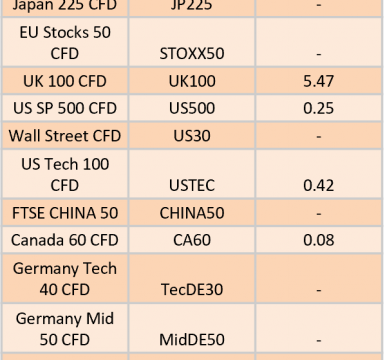
The post Ex-Dividend 30/04/2026 first appeared on IC Your Trading Edge | Official Blog.
429916 April 28, 2026 17:40 ICMarkets Market News

The post Ex-Dividend 29/04/2026 first appeared on IC Your Trading Edge | Official Blog.
429899 April 27, 2026 17:40 ICMarkets Market News

The post Ex-Dividend 28/04/2026 first appeared on IC Your Trading Edge | Official Blog.
429897 April 27, 2026 16:00 ICMarkets Market News
IC Markets Global – Europe Fundamental Forecast | 27 April 2026
What happened in the Asia session?
A tug-of-war between constructive domestic macroeconomic data in China and the persistent shadow of global geopolitical risk. Market participants assessed the March industrial profit figures as a critical indicator of manufacturing resilience, which provided some buoyancy to Chinese assets despite the drag created by the ongoing energy shock and unresolved conflicts in the Middle East.
What does it mean for the Europe & US sessions?
Escalating U.S.-Iran tensions are driving oil prices above $107 per barrel for Brent crude, alongside stalled peace talks impacting global energy costs and equity sentiment as European and U.S. sessions open. Key macroeconomic focuses include China’s industrial profits rising 15.8% in March despite oil disruptions, U.S. stock futures declining amid AI stock flows and broader market divergence, and persistent inflation pressures with year-ahead expectations at 4.7%.
The Dollar Index (DXY)
Key news events today
No major news event
What can we expect from DXY today?
The US Dollar opened higher, buoyed by fading optimism over US-Iran talks that raised Middle East tensions, reinforcing its safe-haven appeal amid ongoing inflation pressures and Fed hawkishness; analysts see consolidation in the Dollar Index but upside risks from energy shocks if ceasefires falter, with key pairs like USD/JPY and EUR/USD underscoring its dominance versus softer global currencies.
Central Bank Notes:
Next 24 Hours Bias
Medium Bullish
Gold (XAU)
Key news events today
No major news event
What can we expect from Gold today?
As of Monday, the price of gold is trading at approximately $4,695.38 per troy ounce, reflecting a daily decline of 0.29%. Despite this recent softening, the precious metal has maintained a strong performance over the longer term, posting a 3.99% gain over the past month and an increase of over 40% compared to the same period last year.
Next 24 Hours Bias
Medium Bullish
The Euro (EUR)
Key news events today
No major news event
What can we expect from EUR today?
The euro is trading cautiously versus major peers, notably the US dollar, as markets digest renewed stagflation worries in the Eurozone and geopolitical headwinds linked to the Iran‑related conflict. Despite some technical bounces, EUR/USD remains near recent lows, underpinned by a relatively hawkish‑leaning ECB that is reluctant to cut rates aggressively amid uneven growth and still‑elevated uncertainty, keeping the euro on a defensive footing heading into the week’s key data releases.
Central Bank Notes:
The next meeting is on 29 April 2026
Next 24 Hours Bias
Weak Bearish
The Swiss Franc (CHF)
Key news events today
No major news event
What can we expect from CHF today?
As of Monday, the Swiss Franc (CHF) is navigating a landscape defined by safe-haven demand, shifting monetary policy expectations, and significant economic data releases. Investors remain particularly focused on liquidity trends and the Swiss National Bank’s (SNB) stance toward currency valuation amidst ongoing regional instability.
Central Bank Notes:
The next meeting is on 18 June 2026.
Next 24 Hours Bias
Medium Bearish
The Pound (GBP)
Key news events today
No major news event
What can we expect from GBP today?
The British pound remains volatile today, Monday, as traders brace for a week of significant economic data and central bank developments in both the UK and the US. The currency is currently navigating a technical environment that suggests potential bearish pressure, with analysts observing a range-bound trade likely between 1.3454 and 1.3608.
Central Bank Notes:
Next 24 Hours Bias
Weak Bearish
The Canadian Dollar (CAD)
Key news events today
No major news event
What can we expect from CAD today?
The Canadian dollar (CAD) showed mild strength today, Monday, trading around 1.3662 USD/CAD by close, down slightly from Friday’s 1.3670 amid ongoing US dollar fluctuations and global risk sentiment. Recent weeks have seen the loonie bolstered by oil price stability and a weaker USD influenced by Middle East tensions and Fed policy expectations, though it faces headwinds from the Bank of Canada’s caution on rates.
Central Bank Notes:
Next 24 Hours Bias
Weak Bearish
Oil
Key news events today
No major news event
What can we expect from Oil today?
Oil prices climbed on Monday, as hopes for a second round of US‑Iran peace talks faded and geopolitical risk in the Middle East flared anew, keeping the Strait of Hormuz supply channel under pressure and pushing Brent crude back toward the mid‑$100s per barrel and WTI closer to $96 per barrel amid ongoing volatility and elevated risk premia.
Next 24 Hours Bias
Medium Bullish
The post IC Markets Global – Europe Fundamental Forecast | 27 April 2026 first appeared on IC Your Trading Edge | Official Blog.
429895 April 27, 2026 15:40 ICMarkets Market News
Dubai, UAE – 10.04.26
IC (previously IC Markets), a leading global provider of online trading services, has announced a strategic partnership with Guillermo Ochoa, accelerating its expansion across Latin America with a sharp focus on Mexico—one of its fastest-growing markets.
An icon of modern football, Ochoa continues to perform at the highest level with AEL Limassol, maintaining his status as one of Mexico’s most trusted and recognizable sporting figures. With a distinguished international career and widely expected to anchor Mexico’s goal in the next cycle of global competition, his influence across Mexico and Latin America remains unmatched.
Through this partnership, IC secures exclusive rights to Ochoa’s name, image, and likeness across global marketing channels, enabling a high-impact, culturally resonant rollout across the region. The collaboration is designed to convert momentum into market dominance—combining IC’s global trading infrastructure with Ochoa’s credibility, reach, and deep-rooted trust among millions of fans.
“This is a strategic move, not a branding exercise,” said Andrew Budzinski, Founder of IC. “Guillermo Ochoa represents performance under pressure, consistency at the highest level, and absolute trust—exactly what trading demands. As we scale aggressively in markets like Mexico, this partnership allows us to cut through faster, connect deeper, and convert stronger.”
Ochoa added: “I have always believed that success comes from discipline, preparation, and performing when it matters most. IC shares that same mindset. This partnership is about connecting with people who are focused on improving, growing, and making smarter decisions every day, and I’m excited to be part of that journey with them.”
IC will activate the partnership through a fully integrated, multi-channel strategy spanning broadcast, digital, and social ecosystems. Premium live match exposure across Latin America, combined with high-performance digital acquisition campaigns and localized content, is expected to significantly expand reach while driving measurable improvements in engagement, conversion, and client acquisition efficiency.
This partnership strengthens IC’s growing global sports portfolio, alongside its high-profile relationship with the Haas F1 Team, reinforcing the brand’s positioning at the intersection of performance, precision, and global scale. As Latin America continues to emerge as a critical growth market, IC is doubling down on strategic investments that deliver both brand impact and commercial returns.
The post IC signs Guillermo Ochoa to Accelerate Growth Across Latin America first appeared on IC Your Trading Edge | Official Blog.
429894 April 27, 2026 15:40 ICMarkets Market News
Asia-Pacific markets mostly advanced on Monday as investors looked beyond renewed diplomatic friction between the United States and Iran, even though rising geopolitical tensions in the Middle East continued to support higher oil prices.
Japan’s Nikkei 225 climbed 1.4% to reach a record high, while South Korea’s Kospi surged 1.83%, also touching a fresh peak. In contrast, Australia’s S&P/ASX 200 slipped 0.54%. Hong Kong’s Hang Seng index edged down 0.17%, whereas mainland China’s CSI 300 gained 0.25% after China reported a strong 15.8% year-on-year rise in March industrial profits, accelerating from the 15.2% growth recorded in the first two months of the year.
Market sentiment remained relatively resilient despite U.S. President Donald Trump canceling plans to send envoys Steve Witkoff and Jared Kushner to Islamabad for talks with Iran, citing internal confusion within Iran’s leadership.
Oil prices jumped roughly 2% after another attempt at peace negotiations between Washington and Tehran stalled. Brent crude rose above $107 per barrel, while U.S. crude climbed near $96.
Tensions also stayed elevated around the Strait of Hormuz following reports that Iran’s Revolutionary Guard boarded two cargo vessels near the strategic shipping route. Meanwhile, U.S. stock futures edged lower, even as the S&P 500 and Nasdaq closed at record highs last Friday.
The post Monday 27th April 2026: Asia-Pacific Markets Rise Despite U.S.–Iran Tensions as Oil Prices Climb first appeared on IC Your Trading Edge | Official Blog.
429893 April 27, 2026 15:00 ICMarkets Market News
IC Markets Global – Asia Fundamental Forecast | 27 April 2026
What happened in the U.S. session?
U.S.-Iran stalemate, the outlook for Fed policy, and lingering inflation pressure from higher oil prices, with Reuters also flagging a political development around Fed chair nominee Kevin Warsh. The most relevant macro backdrop was that U.S. investors were digesting a run of labor-market and growth signals already in focus, while the key overnight theme remained “higher-for-longer” rates risk rather than a fresh blockbuster data surprise.
What does it mean for the Asia Session?
Traders should expect a cautious start with positioning shaped by the coming BoJ, Australia CPI, and China PMI releases, while the main cross-market risk remains the Middle East energy story and its impact on inflation, the yen, and regional risk assets. In practice, that means watching USD/JPY, AUD/USD, oil, gold and Asia equity futures closely, because the market is likely to trade on policy expectations and geopolitics before the week’s biggest data hits.
The Dollar Index (DXY)
Key news events today
No major news event
What can we expect from DXY today?
The dollar starts the week on 27 April 2026 slightly softer, hovering just below 100 on the DXY as traders balance the Fed’s still‑restrictive stance and elevated US yields against expectations of at least one rate cut in 2026 and weakening US consumer sentiment, all while keeping an eye on the 28–29 April FOMC decision and ongoing Middle East headlines.
Central Bank Notes:
Next 24 Hours Bias
Medium Bullish
Gold (XAU)
Key news events today
No major news event
What can we expect from Gold today?
Gold opened Monday in a narrow, choppy range just below 4,800 USD/oz, consolidating after a strong first‑quarter run that lifted prices over 40% year‑on‑year. Markets remain sensitive to Fed policy signals and broader risk‑off headlines, but for now, sentiment is balanced, with many traders positioned for a possible downside break in the near‑term horizon rather than a fresh leg higher.
Next 24 Hours Bias
Medium Bullish
The Australian Dollar (AUD)
Key news events today
No major news event
What can we expect from AUD today?
The Australian dollar (AUD/USD) remains in a period of consolidation, navigating between ongoing geopolitical risks and domestic inflationary pressures. The currency continues to trade within a bullish channel, though it faces technical resistance near the 0.7134 level, with market sentiment currently balancing the potential for a bearish correction against the support provided by a hawkish Reserve Bank of Australia (RBA).
Central Bank Notes:
Next 24 Hours Bias
Medium Bullish
The Kiwi Dollar (NZD)
Key news events today
No major news event
What can we expect from NZD today?
The New Zealand dollar is currently trading with a mild bullish bias, supported by persistent inflation and a more hawkish RBNZ tone, but gains are being capped by global risk uncertainty and the market’s focus on Monday’s trade balance data. A better-than-expected trade number would likely help NZD extend its recent recovery, while a wider deficit could quickly pressure the currency again.
Central Bank Notes:
Next 24 Hours Bias
Weak Bullish
The Japanese Yen (JPY)
Key news events today
No major news event
What can we expect from JPY today?
The yen has been bouncing between short-lived gains and renewed weakness, but the overall tone remains fragile. Recent commentary from BOJ officials has not given traders a strong reason to expect immediate tightening, while repeated warnings from Tokyo suggest policymakers are uncomfortable with the currency’s weakness; that keeps intervention talk alive, especially if USD/JPY pushes closer to 160.
Central Bank Notes:
Next 24 Hours Bias
Medium Bearish
Oil
Key news events today
No major news event
What can we expect from Oil today?
Today’s oil market is characterized by elevated but somewhat stabilized prices driven by lingering geopolitical risk around Iran and the Strait of Hormuz, combined with a cautious OPEC+ strategy that has begun modestly increasing output while reserving the option to cut again if conditions worsen; this backdrop supports a genuinely volatile trading environment where WTI oscillates in the 90s and Brent remains above 100, with every headline on Middle‑East tensions capable of triggering sharp intraday moves.
Next 24 Hours Bias
Medium Bullish
The post IC Markets Global – Asia Fundamental Forecast | 27 April 2026 first appeared on IC Your Trading Edge | Official Blog.
429876 April 27, 2026 15:00 ICMarkets Market News
Potential Direction: Bullish
Overall momentum of the chart: Bearish
The price has already bounced off the pivot and may continue its bullish move toward the 1st resistance
Pivot: 98.01
Supporting reasons: Identified as a pullback support that aligns with the 50% Fiboancci retracement, where renewed buying pressure could emerge to push the price higher.
1st support: 95.80
Supporting reasons: Identified as a swing low support, indicating a potential area where the price could again stabilize.
1st resistance: 100.53
Supporting reasons: Identified as a swing high resistance, indicating a potential area that could halt any further upward movement

Potential Direction: Bearish
Overall momentum of the chart: Bullish
The price has already reacted off the pivot and may continue its bearish move toward the 1st support.
Pivot: 1.1808
Supporting reasons: Identified as an overlap resistance that aligns with the 61.8% Fibonacci retracement, where selling pressures could intensify and potentially cap any upward retracement.
1st support: 1.1631
Supporting reasons: Identified as a pullback support, indicating a potential level where the price could stabilize once again
1st resistance: 1.2044
Supporting reasons: Identified as a swing high resistance, indicating a potential level that could cap further upward movement.

Potential Direction: Bullish
Overall momentum of the chart: Bearish
The price could see a short-term pullback toward the pivot before rising again toward the 1st resistance.
Pivot: 186.22
Supporting reasons: Identified as a pullback support, where renewed buying pressure could emerge to push the price higher.
1st support: 184.64
Supporting reasons: Identified as a pullback support, indicating a potential area where the price could again stabilize.
1st resistance: 189.52
Supporting reasons: Identified as a resistance that aligns with the 161.8% Fibonacci extension, indicating a potential level that could cap further upward movement.

Potential Direction: Bearish
Overall momentum of the chart: Bullish
The price could see a short-term pullback toward the pivot before continuing its bearish move down toward the 1st support.
Pivot: 0.8687
Supporting reasons: Identified as a pullback resistance, where selling pressures could intensify and potentially cap any upward retracement.
1st support: 0.8619
Supporting reasons: Identified as a swing low support, indicating a potential area where the price could stabilize once more.
1st resistance: 0.8769
Supporting reasons: Identified as an overlap resistance, indicating a potential level that could cap further upward movement.

Potential Direction: Bullish
Overall momentum of the chart: Bullish
The price has already bounced off the pivot and may continue its bullish move toward the 1st resistance
Pivot: 1.3461
Supporting reasons: Identified as an overlap support, where renewed buying pressure could emerge to push the price higher.
1st support: 1.3195
Supporting reasons: Identified as an overlap support that aligns with the 78.6% Fibonacci retracement, indicating a potential area where the price could stabilize once more.
1st resistance: 1.3860
Supporting reasons: Identified as a swing high resistance, indicating a potential level that could halt further upward movement.

Potential Direction: Bullish
Overall momentum of the chart: Bullish
The price could make a short-term pullback toward the pivot before rising again toward the 1st resistance
Pivot: 213.22
Supporting reasons: Identified as a pullback support, where renewed buying pressure could emerge to push the price higher.
1st support: 209.64
Supporting reasons: Identified as an overlap support, indicating a potential level where the price could stabilize once more.
1st resistance: 217.18
Supporting reasons: Identified as a resistance that aligns with the 127.2% Fibonacci extension, indicating a potential level that could halt further upward movement.

Potential Direction: Bearish
Overall momentum of the chart: Bearish
The price has already reacted off the pivot and may continue its bearish move toward the 1st support.
Pivot: 0.7871
Supporting reasons: Identified as a pullback resistance that aligns with the 38.2% Fibonacci retracement, where selling pressures could intensify and potentially cap any upward retracement.
1st support: 0.7752
Supporting reasons: Identified as an overlap support, indicating a potential level where the price could stabilize once again.
1st resistance: 0.8030
Supporting reasons: Identified as a swing high resistance, indicating a potential level that could cap further upward movement.

Potential Direction: Bullish
Overall momentum of the chart: Bullish
The price has already bounced off the pivot and may continue its bullish move toward the 1st resistance
Pivot: 157.58
Supporting reasons: Identified as an overlap support, where renewed buying pressure could emerge to push the price higher.
1st support: 154.24
Supporting reasons: Identified as an overlap support, indicating a strong area where buyers might return, and the price could stabilize once again.
1st resistance: 161.74
Supporting reasons: Identified as a swing high resistance. This level represents the next key area where upward movement could be capped amid increased selling pressure

Potential Direction: Bullish
Overall momentum of the chart: Bearish
The price has already bounced off the pivot and may continue its bullish move toward the 1st resistance
Pivot: 1.3647
Supporting reasons: Identified as a pullback support that aligns with the 61.8% Fibonacci retracement, where renewed buying pressure could emerge to push the price higher.
1st support: 1.3547
Supporting reasons: Identified as a swing low support, indicating a key level where the price could stabilize once more.
1st resistance: 1.3940
Supporting reasons: Identified as an overlap resistance, making it a possible target for bullish advances and a level where some sellers could return to cap gains

Potential Direction: Bullish
Overall momentum of the chart: Bullish
The price could make a short-term pullback toward the pivot before rising again toward the 1st resistance
Pivot: 0.6943
Supporting reasons: Identified as a pullback support, where renewed buying pressure could emerge to push the price higher.
1st support: 0.6676
Supporting reasons: Identified as an overlap support, this area has provided strong support historically and may attract buying interest for a potential short-term bounce
1st resistance: 0.7182
Supporting reasons: Identified as a swing high resistance, indicating a potential area that could halt any further upward movement.

Potential Direction: Bearish
Overall momentum of the chart: Bearish
The price has already reacted off the pivot and may continue its bearish move toward the 1st support.
Pivot: 0.5946
Supporting reasons: Identified as an overlap resistance that aligns with the 61.8% Fibonacci retracement, where selling pressures could intensify and potentially cap any upward retracement.
1st support: 0.5774
Supporting reasons: Identified as a pullback support, this area has provided strong support historically and may attract buying interest for a potential short-term bounce
1st resistance: 0.6079
Supporting reasons: Identified a swing high resistance, indicating a potential area that could halt any further upward movement.

Potential Direction: Bearish
Overall momentum of the chart: Bullish
The price could see a short-term pullback toward the pivot before continuing its bearish move down toward the 1st support.
Pivot: 49,687.50
Supporting reasons: Identified as an overlap resistance, where selling pressures could intensify and potentially cap any upward retracement.
1st support: 46,872.00
Supporting reasons: Identified as a pullback support, suggesting a potential area where the price could stabilize once again.
1st resistance: 50,477.23
Supporting reasons: Identified as a swing high resistance, indicating a potential area that could halt any further upward movement.

Potential Direction: Bearish
Overall momentum of the chart: Bullish
The price could see a short-term pullback toward the pivot before continuing its bearish move down toward the 1st support.
Pivot: 24,805.50
Supporting reasons: Identified as a pullback resistance, where selling pressures could intensify and potentially cap any upward retracement.
1st support: 23,332.36
Supporting reasons: Identified as a pullback support, indicating a key level where the price could stabilize once more.
1st resistance: 25,451.76
Supporting reasons: Identified as a swing high resistance, indicating a potential area that could halt any further upward movement.

Potential Direction: Bullish
Overall momentum of the chart: Bullish
The price could make a short-term pullback toward the pivot before rising again toward the 1st resistance
Pivot: 6,992.26
Supporting reasons: Identified as a pullback support, where renewed buying pressure could emerge to push the price higher.
1st support: 6,531.49
Supporting reasons: Identified as a pullback support, indicating a potential level where the price could stabilize once again.
1st resistance: 7,451.23
Supporting reasons: Identified as a resistance that aligns with the 161.8% Fibonacci extension, indicating a potential area that could halt any further upward movement.

Potential Direction: Bearish
Overall momentum of the chart: Bullish
The price has already reacted off the pivot and may continue its bearish move toward the 1st support.
Pivot: 76,476.06
Supporting reasons: Identified as a pullback resistance that aligns with the 50% Fibonacci retracement, where selling pressures could intensify and potentially cap any upward retracement.
1st support: 71,074.92
Supporting reasons: Identified as an overlap support, indicating a potential level where the price could stabilize once more.
1st resistance: 85,026.77
Supporting reasons: Identified as a pullback resistance that aligns with the 61.8% Fibonacci retracement, indicating a potential area that could halt any further upward movement.

Potential Direction: Bearish
Overall momentum of the chart: Bullish
The price could see a short-term pullback toward the pivot before continuing its bearish move down toward the 1st support.
Pivot: 2,618.80
Supporting reasons: Identified as a pullback resistance that aligns with the 50% Fibonacci retracement, where selling pressures could intensify and potentially cap any upward retracement.
1st support: 2,156.71
Supporting reasons: Identified as an overlap support, indicating a potential level where the price could stabilize once more.
1st resistance: 3,053.33
Supporting reasons: Identified as a swing high resistance, indicating a potential area that could halt any further upward movement.

Potential Direction: Bullish
Overall momentum of the chart: Bullish
The price has already bounced off the pivot and may continue its bullish move toward the 1st resistance
Pivot: 87.53
Supporting reasons: Identified as an overlap support, where renewed buying pressure could emerge to push the price higher.
1st support: 73.75
Supporting reasons: Identified as a pullback support, indicating a key level where the price could stabilize once more.
1st resistance: 119.24
Supporting reasons: Identified as a pullback resistance, indicating a potential area that could halt any further upward movement.

Potential Direction: Bearish
Overall momentum of the chart: Bullish
The price has already reacted off the pivot and may continue its bearish move toward the 1st support.
Pivot: 4,858.96
Supporting reasons: Identified as a pullback resistance that aligns with the 61.8% Fibonacci retracement, where selling pressures could intensify and potentially cap any upward retracement.
1st support: 4,367.70
Supporting reasons: Identified as an overlap support, indicating a key level where the price could stabilize once more.
1st resistance: 5,464.42
Supporting reasons: Identified as a swing high resistance, indicating a potential area that could halt any further upward movement.

The accuracy, completeness and timeliness of the information contained on this site cannot be guaranteed. IC Markets Global does not warranty, guarantee or make any representations, or assume any liability regarding financial results based on the use of the information in the site.
News, views, opinions, recommendations and other information obtained from sources outside of www.icmarkets.com, used in this site are believed to be reliable, but we cannot guarantee their accuracy or completeness. All such information is subject to change at any time without notice. IC Markets Global assumes no responsibility for the content of any linked site.
The fact that such links may exist does not indicate approval or endorsement of any material contained on any linked site. IC Markets Global is not liable for any harm caused by the transmission, through accessing the services or information on this site, of a computer virus, or other computer code or programming device that might be used to access, delete, damage, disable, disrupt or otherwise impede in any manner, the operation of the site or of any user’s software, hardware, data or property.
The post Monday 27th April 2026: Technical Outlook and Review first appeared on IC Your Trading Edge | Official Blog.
429870 April 27, 2026 14:40 ICMarkets Market News
It was another big week for markets last week, with geopolitical updates from the Middle East again dominating market moves. However, sentiment remained high, with several bourses again hitting record levels despite a distinct lack of progress in the Persian Gulf.
The week ahead is a massive one for markets, with further geopolitical updates likely to hit markets, as well as a very full macroeconomic calendar featuring no less than five major central banks set to make interest rate calls, some major tier 1 data due for release, and big earnings updates from major tech firms in the US.
News out of the US of a shooting incident at an event attended by President Trump on Saturday is unlikely to lead to major moves in the market. However, the update that he cancelled the trip of key negotiators to Pakistan may lead to some downside sentiment moves on the Monday open.
Here is our usual day-by-day breakdown of the major risk events this week:

It is very much the calm before the central bank storm on Monday, with very little on the macroeconomic calendar. Again, geopolitical updates from the weekend are likely to add to volatility on the open.

The calendar kicks into action on Tuesday, with the main event coming in the first session of the day, when the Bank of Japan announces its latest interest rate decision. There is little of note in the London session, but the New York day sees the first major US data of the week in the form of CB Consumer Confidence data early in the session.

It’s a big calendar day on Wednesday. The initial focus will be on Australian markets in the Asian session, with key CPI data due out. The London session will see German CPI numbers delivered across the course of the day. However, the big events will bookend the US session, with the Bank of Canada making its rate call early in the day, before, a few hours later, we hear from the Federal Reserve Bank on what could be Jerome Powell’s last update as Chairman.

It is a massive day on the event calendar on Thursday, although the Asian session is relatively quiet. The London session sees updates coming thick and fast, with German GDP data due out before key EU CPI flash numbers. Then, later in the session, we have the big interest rate calls from the Bank of England and the European Central Bank. The New York session is equally as busy, with both Canadian and US GDP data out, alongside the US Core PCE Price Index, Employment Cost Index, and weekly unemployment claims numbers.

Traders will be hoping for a quiet day to close out the week on Friday, and it is quiet on the economic calendar. However, bank holidays in several major centres may lead to exacerbated moves if any fresh geopolitical updates hit the newswires.
The post The Week Ahead – Week Commencing 27 April 2026 first appeared on IC Your Trading Edge | Official Blog.